Over the past two years, Russia’s foreign trade has been subjected to a record number of restrictions and other external shocks that affected the demand for Russian exports, the supply of imports to Russia, and foreign trade costs. Certain restrictions had immediate effects disrupting the established logistics chains, inducing problems in conducting transactions and cutting off many business contacts, in part because western companies discontinued their operations in Russia. This had an immense impact on Russia’s imports. Contrastingly, the restrictions affecting Russia’s core exports, primarily crude and petroleum products, took effect many months after their announcement. Accordingly, import flows began to transform earlier than export ones. However, over the six months starting from mid-2023, the value of both import and export flows stabilized at new levels, namely at approximately the 2021 and 2019 levels, respectively.
Frequently, the dominant opinion in the discussions of foreign trade is the priority of export development, with export expansion and support considered to be the top priority. However, in the current situation, the medium-term objective for Russia is totally different: it is more important to ensure stable imports of goods and equipment that are critical to production chains and consumption. The immediacy of the problem is partially alleviated by the scale of Russia’s economy, which is obvious from the example of the aviation industry: the size of the fleet helps address the shortage of spare parts by disassembling a contingent of the aircraft. Nevertheless, the technology dependence on imports in aviation and many other industries will remain in the long term.
Part of the goods that are critical to the economy are the focus of the sanction pressure, and support for their imports is a complicated task to be solved. In the first place, many of these goods are manufactured only in advanced economies that are on the list of ‘unfriendly’ states, which requires the use of parallel import schemes. Secondly, as such goods are unique, the supply chains connected with them are more likely to be traced, which augments the risks of secondary sanctions on the counterparties. Thirdly, the restrictions on after-sales maintenance increase the cost of using these goods. Critical goods account for a small portion of Russia’s total imports, and therefore the changes in their supplies had a weak effect on import dynamics. Nonetheless, the analysis of total imports reveals a number of patterns.
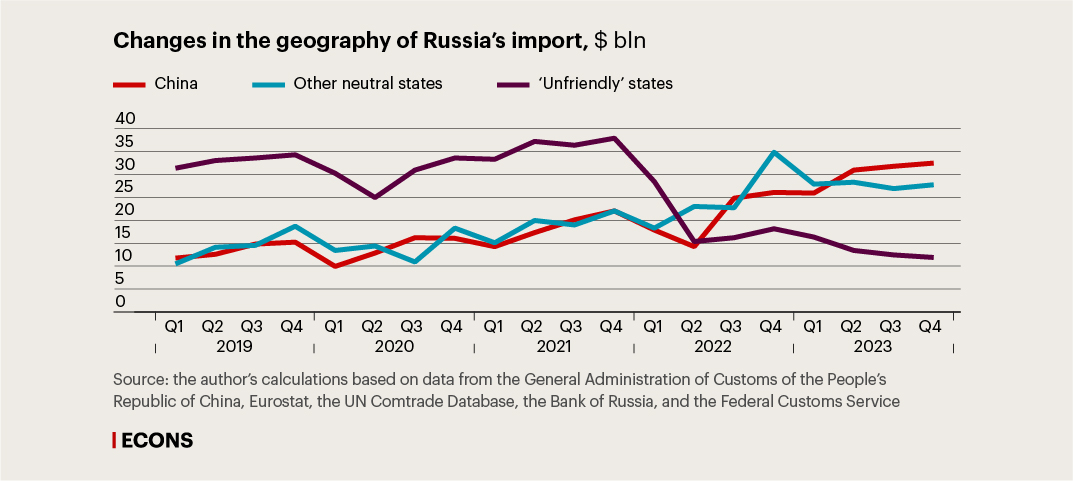
Finding 1. Equipment and component supplies from China did not replace those from the EU.
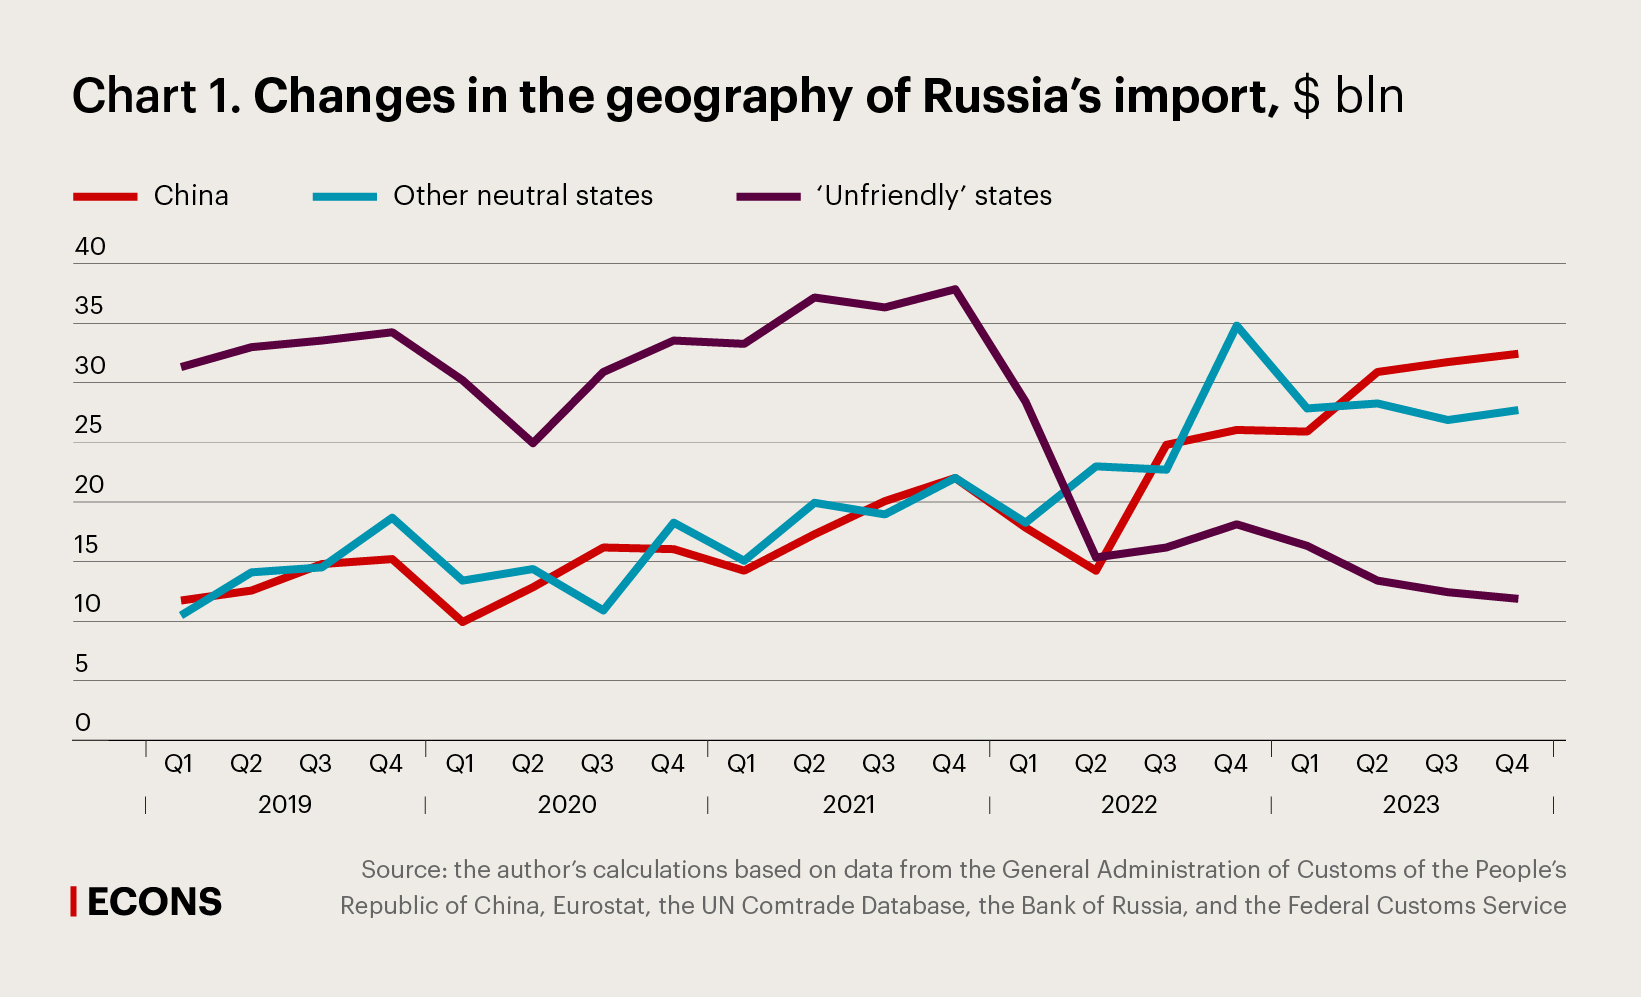
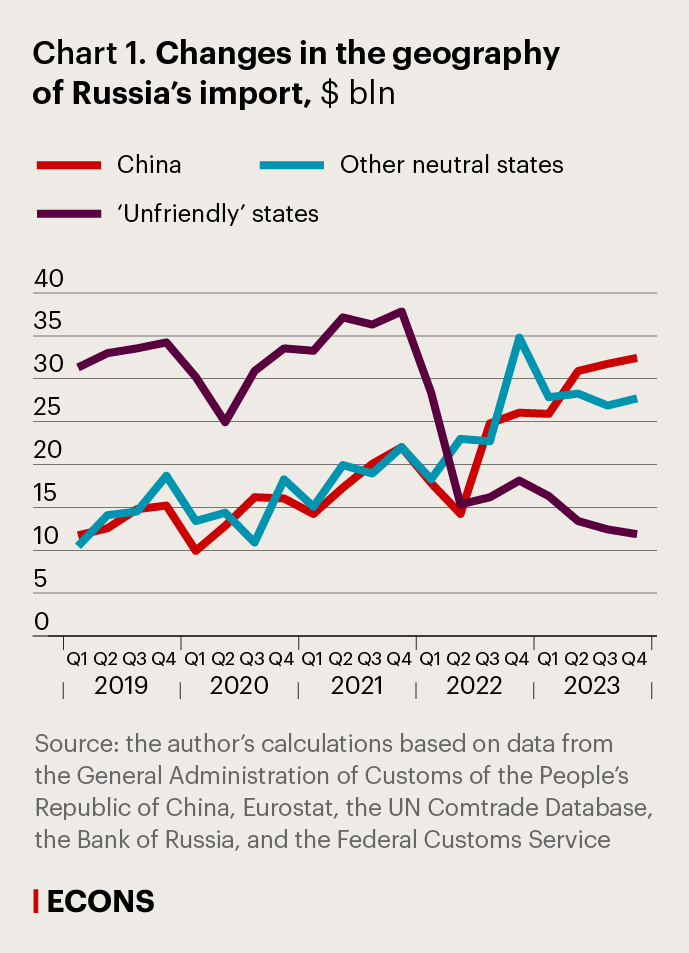
Overall imports bounced back to almost pre-crisis levels (-9% in the second half of 2023 compared to the same period of 2021), driven by surging supplies from China (+53%) and other neutral states (+31%) offsetting the threefold decline in direct imports from ‘unfriendly’ countries (-66%). As a result, the EU was replaced by China as the main source of imports, with its share in total imports growing from 27% to 45%, whereas advanced economies’ share in Russia’s imports plummeted from 47% to 17%. Moreover, in 2022, prices for EU goods imported to Russia rose by 7% compared to other sales markets.
However, the contraction of EU supplies and the substitution of European goods for Chinese ones in the Russian market are uneven and depend on the parameters of particular product groups (see Chart 2).
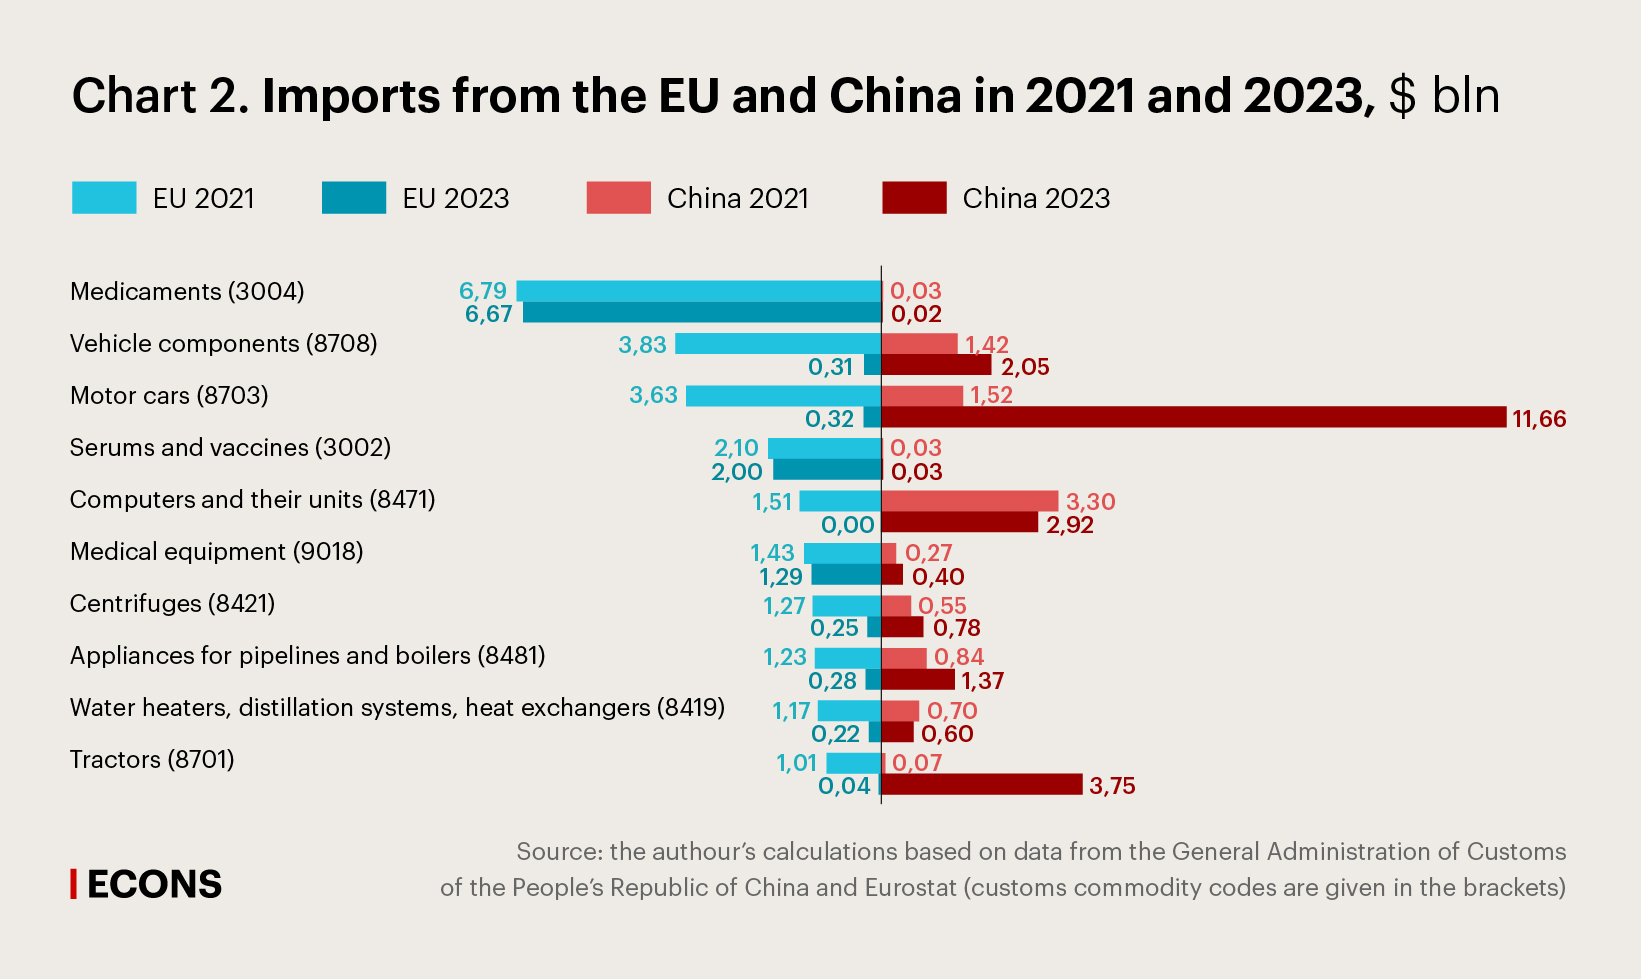
On the one hand, the quantities of life-critical goods imported from the EU (pharmaceuticals, vaccines, and medical equipment) remained nearly the same, despite the persistent problems in logistics and the existing restrictions on cross-border payments. The import of pharmaceuticals and medical equipment from China stayed at a very low level, especially taking into account China’s dominance in Russia’s imports (45%).
On the other hand, direct supplies of equipment from the EU were almost terminated. Among the largest product groups, the replacement with Chinese imports is significant only in terms of tractors and motor vehicles. In addition, a weak increase in the import of Chinese spare parts and components is evidence that the efforts to localise the manufacture and assembly of Chinese cars produced limited results. Hence, by the end of the period under review, the growth of Chinese supplies had been driven primarily by the import of finished goods.
Finding 2. A large share of commodities ensured the stability of exports.
The experience of 2022–2023 shows that the supplies of commodities (except for pipeline natural gas) can be redirected to other markets within a very short time as homogeneous goods that are Russia’s core exports are demanded among both advanced and emerging market economies (see Chart 3).
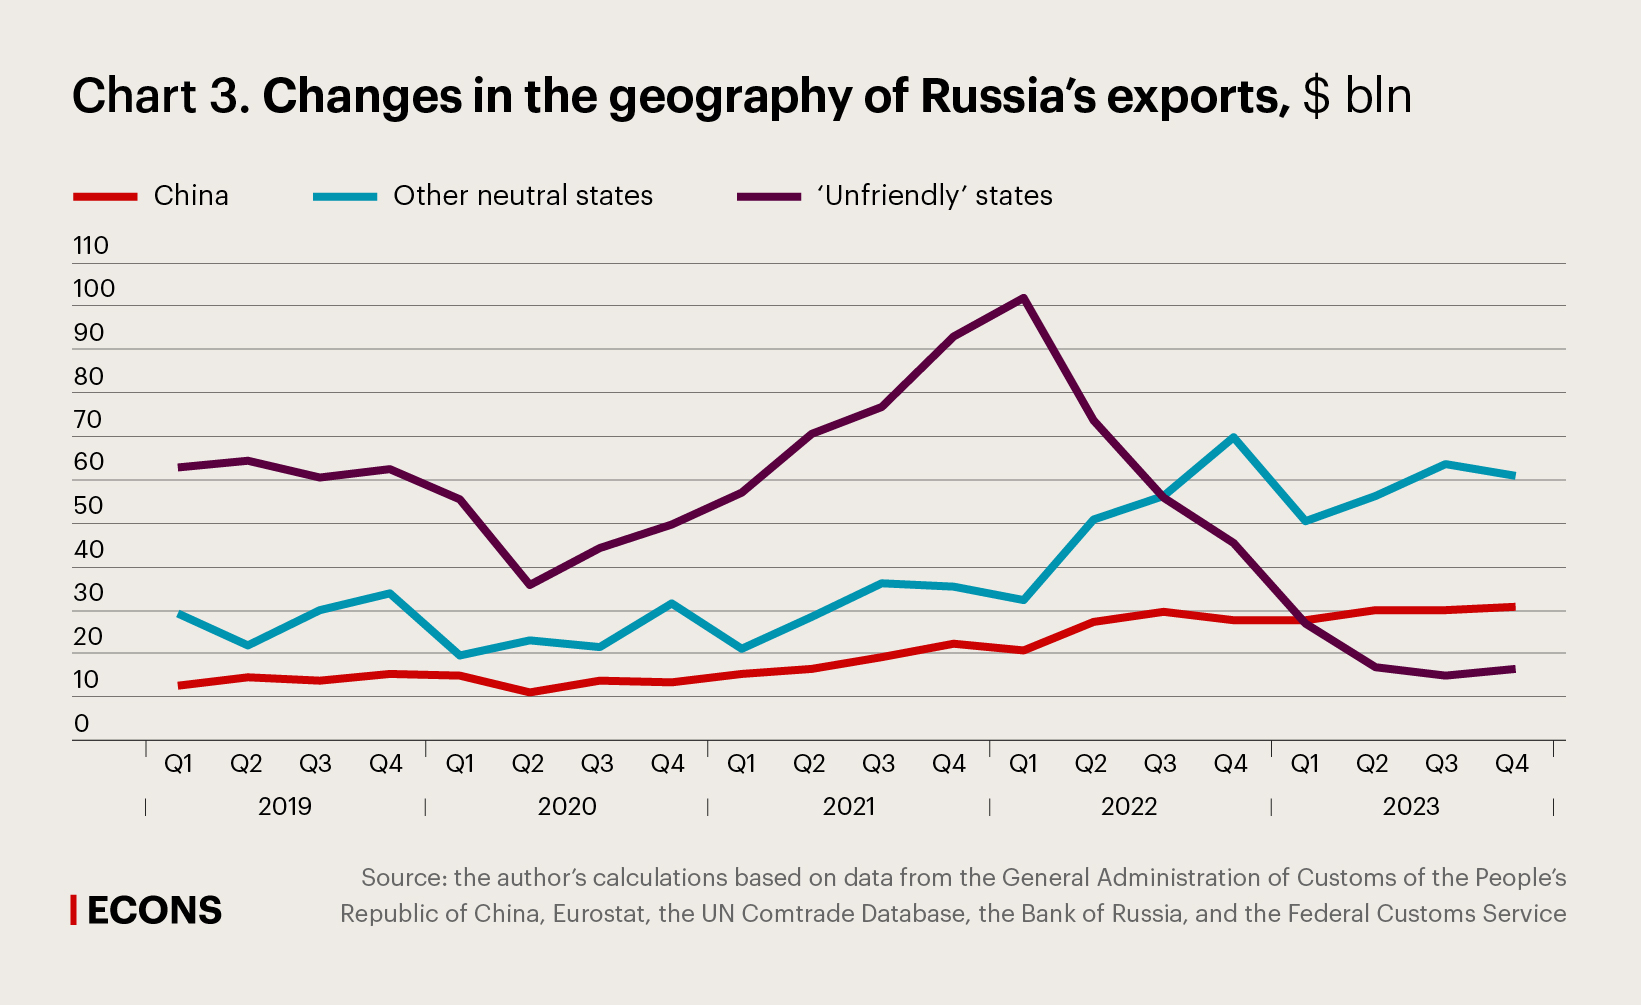
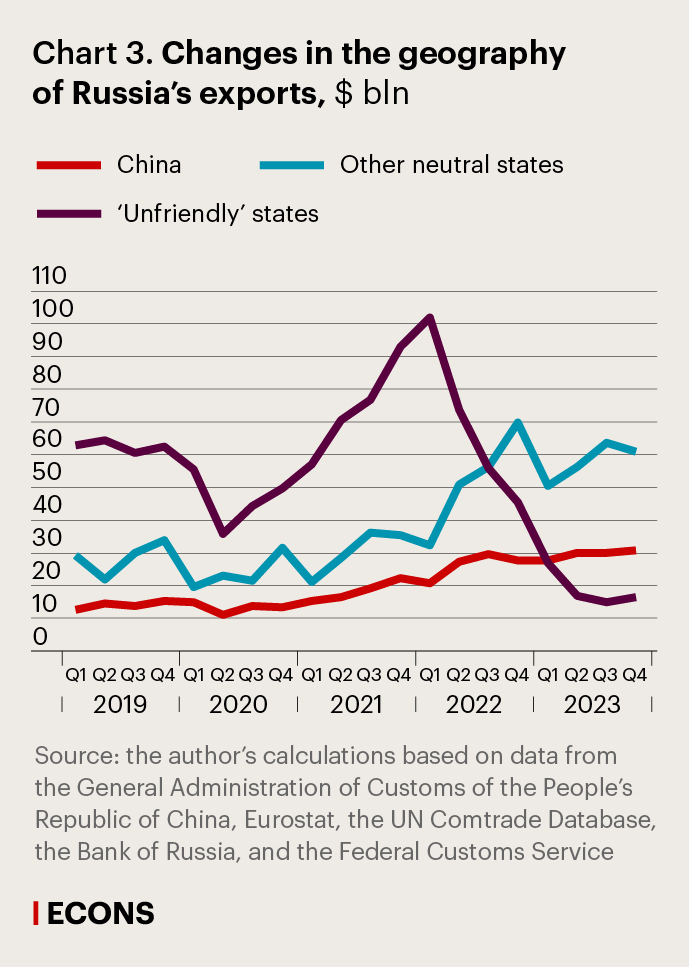
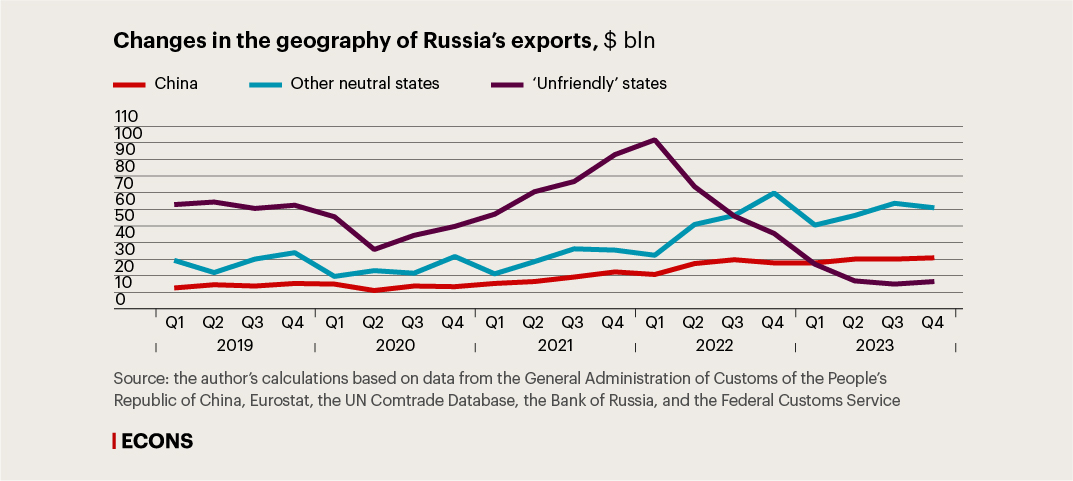
The value of exports usually depends on prices. After energy commodity prices normalised, the value of exports returned to pre-pandemic levels (+0.5% in the second half of 2023 compared to the same period in 2019). A twofold expansion of supplies to China (+112%) and other neutral countries (+94%) offset a fourfold reduction in Russian exports to ‘unfriendly’ states (-75%). As a result, in mid-2023, the geography of exports, just as of imports, shifted towards neutral countries, with the share of ‘unfriendly’ markets plummeting from 57% to 15% and that of China – growing from 13% to 28%.
Finding 3. Oil discounts supported its exports.
In the conditions of the sanctions, the objective of maintaining the level of Russia’s core exports in the short term came down to the redirection of supplies to alternative markets by offering discounts. The key was to determine the size of an adequate discount. Simply put, if the discount is 5%, the supplier will ultimately find a buyer of any commodity; if the discount is 10%, buyers will find the supplier themselves; and if the discount is 20%, the supplier will get a queue of buyers. Therefore, discounts can be expected to be higher when supplies increase or exporters enter new markets, with a subsequent decrease in discounts as trade flows stabilise. This assumption is consistent with the changes observed in the discount on Russian crude in the key Chinese market (see Chart 4).
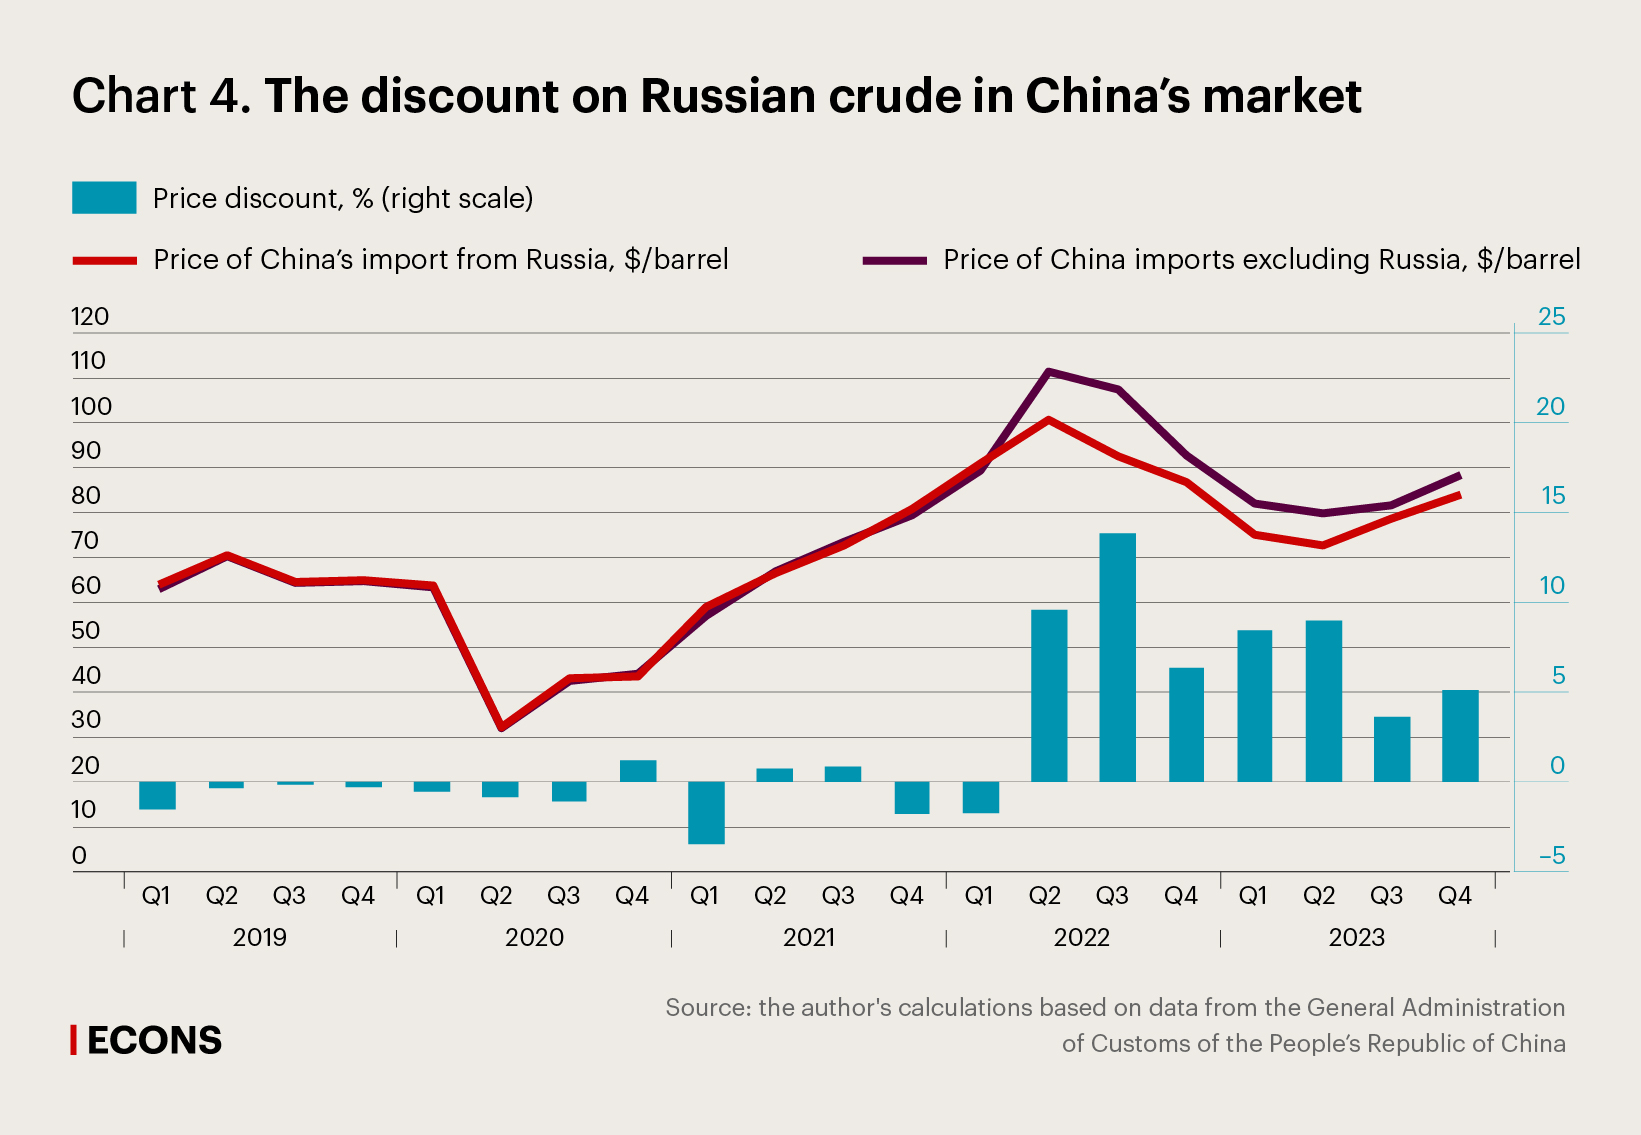
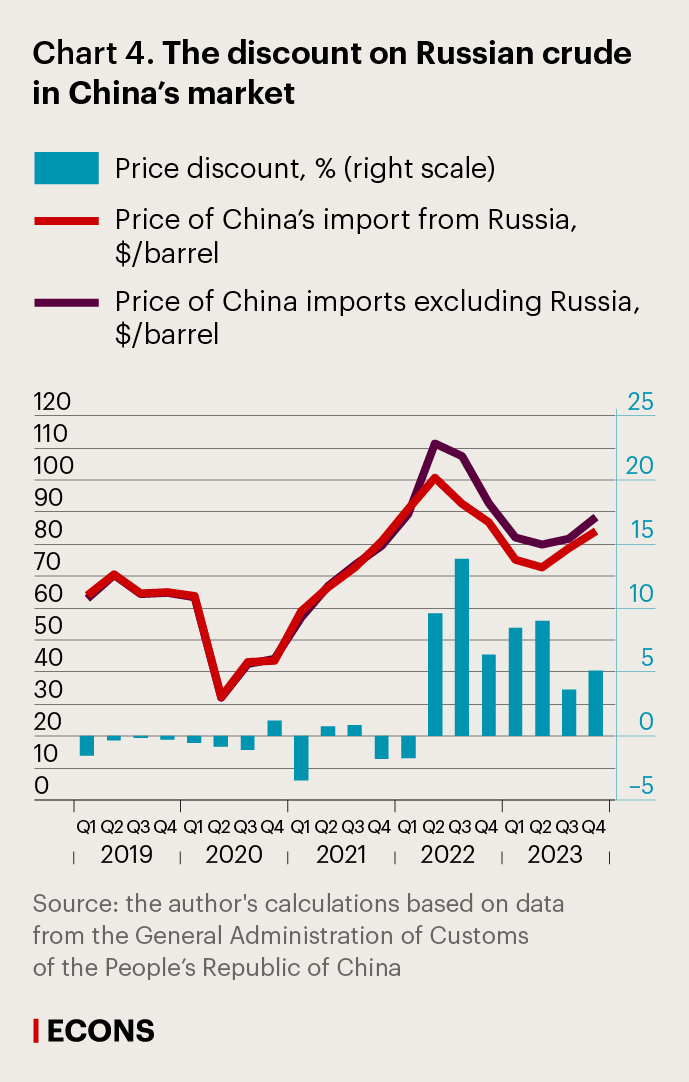
The discount emerged when Russian crude supplies to the Chinese market expanded – they surged by a third from 79.7 million tonnes in 2021 to 107 million tonnes in 2023. The discount was higher during the periods when the share of Russian crude in China’s market was growing. The total amount of the discounts in 2023 was approximately $4 billion, with Russian crude exports to China totalling $61 billion. Noteworthy, the average price of crude exported from Russia that is published by the General Administration of Customs of the People’s Republic of China remains considerably higher than the price cap set by the coalition of ‘unfriendly’ states.
Finding 4. The surplus forms because of ‘risky’ neutral states.
Russia maintained a trade surplus (nearly $140 billion, according to the Federal Customs Service – .xlsx), (data in Russian) although it shifted towards other neutral countries and not all of them can be considered fully solvent. Considering the limited convertibility of the currencies of a number of important neutral partners, primarily India, the surplus of trade with these countries involves risks of delays in payments to Russian exporters or of payments in non-convertible currencies.
In 2023, trade turnover with ‘unfriendly’ countries became almost balanced, with exports slightly exceeding imports, in contrast to previous years when the balance of trade with that group of states had been steadily positive. Trade turnover between Russia and China became nearly balanced as well, which had been typical of the past few years.
Finding 5. Substitution of the US dollar and euro does not eliminate risks of secondary sanctions.
Despite the stabilisation of Russia’s foreign trade, there is a whole range of problems, including risks of secondary sanctions as the main threat.
Immediately after Joe Biden’s executive order issued on 22 December 2023 to simplify the procedure for enacting secondary sanctions, mass media started to report (link in Russian) that a number of Turkish banks (link in Russian) had decided to terminate cooperation with Russian banks and that Chinese banks (link in Russian) were refusing to process settlements and had tightened control of transactions. Importantly, this news was related to the two countries that are crucial for Russian imports, that is, China being the largest supplier and Turkey that, due to its geographical location and political conditions, is one of the most likely alternative channels for EU supplies to Russia. Furthermore, the restrictions affected settlements in both currencies of ‘unfriendly’ countries and the national currencies of Russia’s trading partners (link in Russian). This situation was yet more evidence that the importance of the transition to settlements in national currencies has been overestimated, and the transition as such cannot solve the problem of secondary sanctions.
Finding 6. The geography of imports is extremely concentrated.
Another feature of Russian imports is the dominance of China that accounted for 45% in the second half of 2023. The mere fact that a single country accounts for such a significant share in imports involves risks, as China will have a very strong bargaining position in any commercial disputes that will inevitably arise. Moreover, China’s exports are dominated by supplies to the USA, the EU and other ‘unfriendly’ countries, while Russia is still of secondary importance to China as a sales market (ranking 6th) with a share of 3.4%. Obviously, most Chinese companies would prefer not to jeopardise their right to access key markets because of Russia, whereas Russia would face difficulties if it had to replace Chinese suppliers.
Anyway, ‘unfriendly’ states will continue their efforts to identify the trade flows that they consider undesirable and enact secondary sanctions against Russia’s partners. There are only a few ways to reduce these risks, and among of them are geographical diversification of foreign trade and an alternative settlement infrastructure development.


