Discussions of Russian exports usually begin with the issue of their focus on oil and gas: the energy sector still predominates as far as the value of exports of goods and services (51.6% in 2018) is concerned. However, if we look at export volumes rather than value, we see that their average growth of 4.6% between 2016 and 2018 was in fact largely generated by an increase in non-commodity exports of goods and services: 8% a year on average, due to relatively fast global growth and a weak rouble. It is the volume of exports, rather than their value, with which this article is concerned.
In the first quarter of 2019, the total volume of exports went down for the first time since Q1 of 2016, falling by 0.4% after growth of 2.6% per annum in the preceding quarter, Q4 of 2018. Data on export volumes in Q2 have not yet been released, but the trend is likely to have deteriorated: as the global economy slows down, external demand for Russian exports is decreasing, which hits non-commodity exports the hardest. Many sectors that used to lead growth have become outsiders, including machinery and equipment, the agricultural and food industry, the chemical industry, and services.Connected with its partners
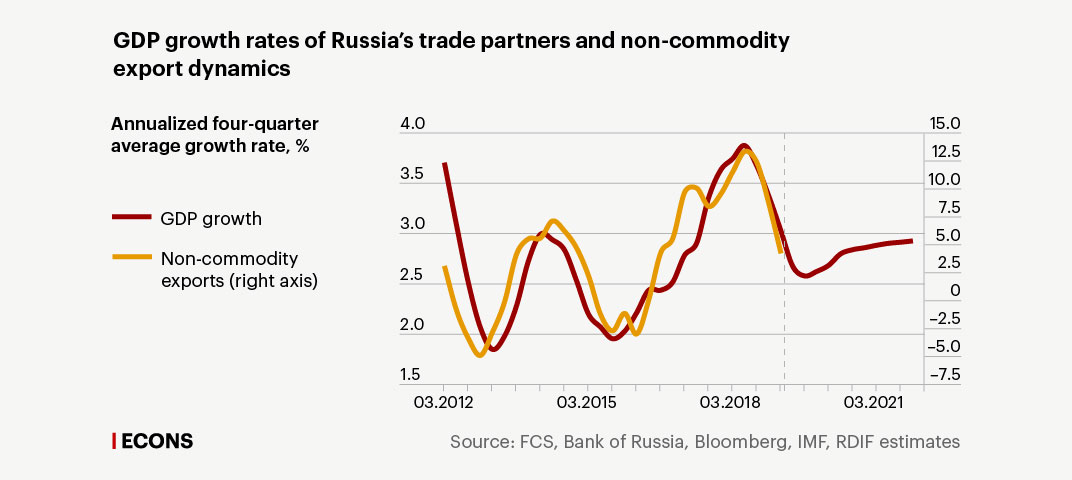
Russian non-commodity export dynamics correlate directly with the GDP growth rate of our trade partners. The relationship between Russia’s non-commodity exports and the economic performance of the 46 countries that import 80% its of non-commodity goods and services is quite strong: since 2012, every 0.1 p.p. of GDP growth in these countries has been equal to an increase of about 0.7 p.p. in Russia’s non-commodity exports (estimated using an annualized four-quarter moving average).
GDP growth rates of Russia’s trade partners and non-commodity export dynamics
Non-commodity exports (right axis)
GDP growth
4.0
15.0
12.5
3.5
10.0
7.5
3.0
5.0
2.5
2.5
0
–2.5
2.0
–5.0
1.5
–7.5
03.2012
03.2015
03.2018
03.2021
Source: FCS, Bank of Russia, Bloomberg, IMF, RDIF estimates
Non-commodity exports (right axis)
GDP growth
4.0
15.0
12.5
3.5
10.0
7.5
3.0
5.0
2.5
2.5
0
–2.5
2.0
–5.0
1.5
–7.5
03.2012
03.2015
03.2018
03.2021
Source: FCS, Bank of Russia, Bloomberg, IMF, RDIF estimates
GDP growth
Non-commodity exports (right axis)
4.0
15.0
12.5
3.5
10.0
7.5
3.0
5.0
2.5
2.5
0
–2.5
2.0
–5.0
1.5
–7.5
03.2012
03.2015
03.2018
03.2021
Source: FCS, Bank of Russia,
Bloomberg,IMF, RDIF estimates

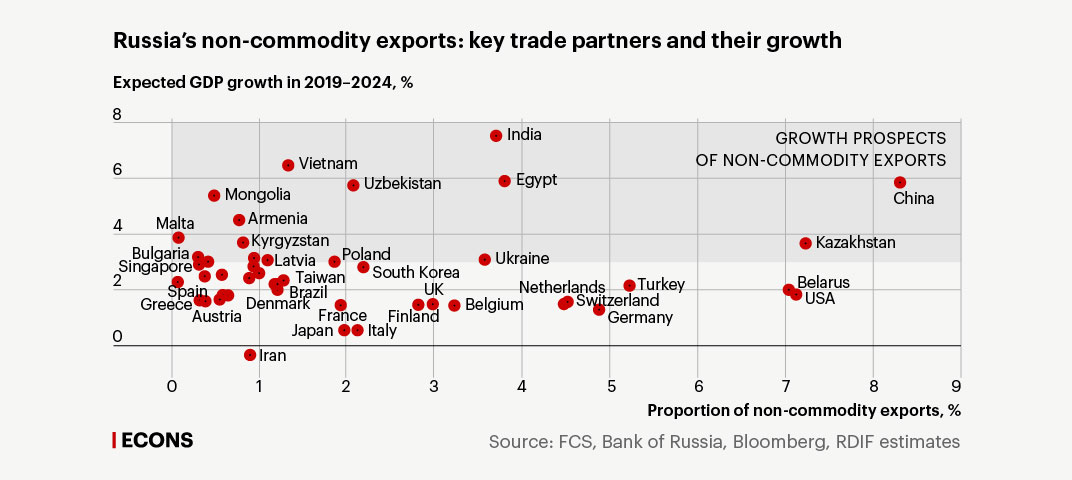
Our trade partners have varying growth prospects (according to the IMF’s World Economic Outlook Reports published in April and July), but only 10 of 46 will grow at the global rate or faster, i.e. faster than 3.5% a year. These countries account for less than 30% of Russia’s non-commodity exports (see the chart).
In the first half of 2017 to the first half of 2018, the GDP growth of Russia’s trade partners reached a record 3.8–3.9%, but then slowed to 2.4–2.6% in the first half of 2019. Against this backdrop, the growth rate of Russia’s non-commodity exports slumped from 8–15% per annum to negative 2.4% at the end of Q1 this year.
If the trends of the last 6–7 years persist in the future, the growth rate of Russia’s non-commodity exports could drop from 7.9% to 2.5–4% in 2019.
Russia’s non-commodity exports: key trade partners and their growth
Expected GDP growth in 2019–2024, %
8
Growth prospects
of non-commodity exports
India
7
Vietnam
6
Egypt
China
Uzbekistan
Mongolia
5
Armenia
4
Malta
Kyrgyzstan
Kazakhstan
Israel
Slovakia
3
Ukraine
Latvia
Poland
Romania
Bulgaria
Estonia
South Korea
Hungary
Czechia
Singapore
Taiwan
Lithuania
2
Azerbaijan
Mexico
Turkey
Croatia
Belarus
Brazil
Netherlands
Spain
USA
Sweden
UK
Greece
Denmark
Switzerland
Belgium
Austria
Germany
Finland
France
1
Italy
Japan
0
Iran
–1
0
1
2
3
4
5
6
7
8
9
Proportion of non-commodity exports, %
Source: FCS, Bank of Russia, Bloomberg, RDIF estimates
Expected GDP growth in 2019–2024, %
8
Growth prospects
of non-commodity exports
India
7
Vietnam
6
Egypt
China
Uzbekistan
Mongolia
5
Armenia
4
Malta
Kyrgyzstan
Kazakhstan
Slovakia
Israel
3
Latvia
Ukraine
Poland
Romania
Bulgaria
Estonia
South Korea
Hungary
Czechia
Singapore
Taiwan
Lithuania
2
Mexico
Turkey
Azerbaijan
Croatia
Belarus
Brazil
USA
Spain
Netherlands
Sweden
UK
Greece
Denmark
Switzerland
Belgium
Austria
Germany
France
Finland
1
Japan
Italy
0
Iran
–1
0
1
2
3
4
5
6
7
8
9
Proportion of non-commodity exports, %
Source: FCS, Bank of Russia, Bloomberg, RDIF estimates
Expected GDP growth in 2019–2024, %
8
Growth prospects
of non-commodity exports
India
7
Vietnam
6
Egypt
China
Uzbekistan
Mongolia
5
Armenia
4
Malta
Kyrgyzstan
Kazakhstan
Slovakia
Israel
3
Latvia
Ukraine
Poland
Romania
Bulgaria
Estonia
South Korea
Венгрия
Czechia
Singapore
Taiwan
Lithuania
2
Mexico
Turkey
Azerbaijan
Croatia
Belarus
Brazil
Spain
USA
Netherlands
Sweden
UK
Greece
Denmark
Switzerland
Belgium
Austria
Germany
France
Finland
1
Japan
Italy
0
Iran
–1
0
1
2
3
4
5
6
7
8
9
Proportion of non-commodity exports, %
Source: FCS, Bank of Russia, Bloomberg, RDIF estimates
Proportion of non-commodity exports, %
Expected GDP growth in 2019–2024, %
-1
0
1
2
3
4
5
6
7
8
9
China
Kazakhstan
USA
Belarus
Turkey
Germany
Netherlands
Switzerland
Egypt
India
Ukraine
Belgium
UK
Finland
South Korea
Italy
Uzbekistan
Japan
France
Poland
Vietnam
Taiwan
Brazil
Azerbaijan
Mexico
Latvia
Czechia
Israel
Estonia
Iran
Lithuania
Kyrgyzstan
Armenia
Sweden
Spain
Hungary
Denmark
Mongolia
Romania
Austria
Growth
prospects of
non-commodity
exports
Singapore
Greece
Bulgaria
Slovakia
Malta
Croatia
-1
0
1
2
3
4
5
6
7
8
9
Source: FCS, Bank of Russia,
Bloomberg, RDIF estimates

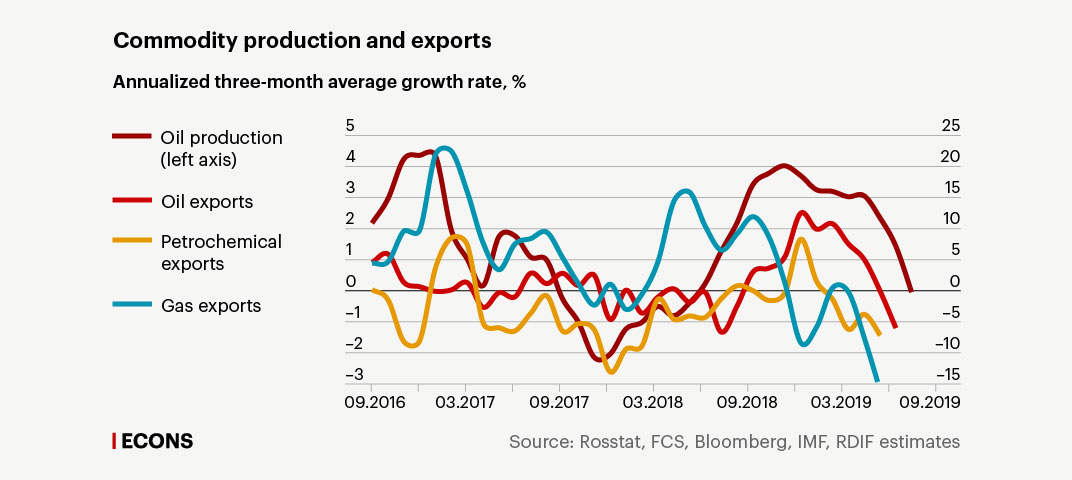
The prospects for commodity exports are not too rosy either: by the end of the year, exports of oil, petrochemicals, and gas will have shrunk by 1–2%. In Q1, growth persisted but slowed to 1.3% from 6.1% in Q4 of 2018. The OPEC+ agreement, under which Russia undertook to cut its oil production, does not play a particularly important role here: production is already lower than it should be. Due to the nature of oil extraction in winter, Russia was gradually decreasing its production at the beginning of the year and reached the agreed level only in May, which is why the agreement did not affect the export volume in Q1. In May–July, Russia’s production was lower than stipulated in the OPEC+ agreement due to contamination in the Druzhba pipeline, planned maintenance, and some other temporary factors. Given the data for April–May, Russia’s commodity exports could have slumped by 7–8% in Q2.
Commodity production and exports
Oil exports
Oil production (left axis)
Petrochemical exports
Gas exports
5
25
4
20
3
15
2
10
1
5
0
0
–1
–5
–2
–10
–3
–15
09.2016
12.2016
03.2017
06.2017
09.2017
12.2017
03.2018
06.2018
09.2018
12.2018
03.2019
06.2019
09.2019
Source: Rosstat, FCS, Bloomberg, IMF, RDIF estimates
Oil exports
Oil production (left axis)
Petrochemical exports
Gas exports
5
25
4
20
3
15
2
10
1
5
0
0
–1
–5
–2
–10
–3
–15
09.2016
03.2017
09.2017
03.2018
09.2018
03.2019
09.2019
Source: Rosstat, FCS, Bloomberg, IMF, RDIF estimates
Oil production (left axis)
Oil exports
Petrochemical exports
Gas exports
5
25
4
20
3
15
2
10
1
5
0
0
–1
–5
–2
–10
–3
–15
09.2016
09.2017
09.2018
09.2019
Source: Rosstat, FCS,
Bloomberg, IMF, RDIF estimates

A challenge for the economy
These estimates suggest that Russia’s total export growth could slow to 0.5–1.5% in 2019 compared to 5.5% in 2018.
This rate is lower than that forecasted by the Ministry of Economic Development (2.3%) but is in line with recent estimates from the Bank of Russia (0.8–1.3%). According to forecastes and our estimates, export growth might accelerate to 2.5–3.5% (our estimates), 3.2% (the Ministry of Economic Development) or 2.7–3.2% (the Bank of Russia) in the future, in 2020–2021. In other words, exports will remain a key driver of Russia’s economic growth.
However, all these forecasts suggest that, over the next three years, export growth will be lower than in preceding years (4.6% per annum on average in 2016–2018). There is an objective reason for this: the global slowdown caused by the risk of global protectionism. How this situation will resolve itself remains a matter of considerable uncertainty.
For this reason, any negative news will trigger another drop in global growth projections and so add to the challenges facing the Russian economy.
The official forecasts do not seem unrealistic, but increased growth in exports (5% and 5.5% in 2017 and 2018 respectively) will require increased growth by Russia’s trade partners or additional economic policy efforts and measures.
The International Cooperation and Export National Priority Project launched in 2018 makes the assumption that non-commodity exports will grow to 350 billion dollars by 2024, up from 213 billion dollars in 2018. To attain this growth, the Project proposes a series of measures: improvement of international trade logistics, elimination of customs and administrative barriers, financial assistance for exporters, and liberalization of visa regimes to enhance tourism to Russia and exports of services.
Moreover, a shift of focus on Russia’s part to countries with higher GDP growth (for instance, Asian countries and certain emerging countries), which can provide higher demand for Russian goods, would seem logical. However, it is important to take into account the level of protectionism in international trade and the internal market protection measures that are primarily used by emerging countries. What’s more, protectionism is increasingly gaining ground as ever more countries are sucked into trade wars. For this reason, focusing on new markets does not negate the need to enlarge the presence of Russia’s goods in its usual markets. Favourable price dynamics might help achieve nominal export goals, but in the current environment of global slowdown and a structural decrease in inflation, it would be risky to rely on price dynamics alone.
Exports and the National Welfare Fund
The rouble exchange rate, which has played a role in boosting exports in recent years, is also worth taking into account. This boost to exports was connected partly with external factors and partly with the new version of the fiscal rule, and has helped to stabilize the rouble real exchange rate and partially unpeg it from oil prices. The real effective exchange rate of the rouble (the rouble’s exchange rate against the currencies of Russia’s trade partners weighted by their proportion and adjusted for inflation) has gained 9% on its lowest 2018 values, which could also have harmed export growth.
The decision taken by the government with regard to spending extra oil revenues when the liquid assets of the National Welfare Fund (NWF) reach 7% of GDP will also be important for the rouble’s mid-term prospects.
We believe that these decisions, if taken, will de facto increase the budget oil price, set at $40 per barrel (at 2017 values) by the fiscal rule, and decrease foreign currency purchases, which could strengthen the rouble and/or make it more sensitive to oil price volatility, all other things being equal. On the one hand, a stronger rouble will be advantageous for importing the equipment and technologies necessary for re-equipment and efficiency growth. On the other, it will make non-commodity goods less competitive. Therefore, in future discussions of NWF spending, it will be crucial to consider the implications of this decision for the exchange rate, exports, inflation, and, ultimately, GDP growth.

