Explosion in Unemployment: Fact or Fiction?
The official statistics: bad, but not dire
The government can support workers whose skills are not in demand during the crisis through two key channels. The first is the unemployment insurance system, granting unemployment benefits to those who have lost their jobs. The second channel is businesses: the state can provide them with the money to pay either full or partial wages to underemployed workers (transferred to part-time work or forced to take leaves of absence) whose skills are temporarily not needed during the crisis.
Both methods mean that the labour force is not used at its full capacity. The sole difference is that, in the first case, employees lose their connection to the workplace, while in the second case, that connection is maintained. As a result, in the first scenario, which is ‘strict’ unemployment, labour underutilisation is associated with much greater risks and losses than in the second, i.e. ‘softer’ underemployment.
In the current crisis, all countries have used both channels, albeit in varying proportions. For instance, the U.S. and Canada have largely preferred the first one, which has led to soaring unemployment rates: in the US, it went up from 3.5% to 14.7%. Most European countries have chosen the second channel; thus, their unemployment rate increased by a mere 0.2 p.p., from 6.5% to 6.7% (average rate across EU member states).
Previously, Russian policy always favoured the second mechanism of social support over the first one: in tough times, the government preferred to subsidise underemployment through enterprises by partly reimbursing businesses for paying underemployed workers, while unemployment benefits were constantly kept at a low level, with access to them being hindered by serious administrative restrictions.
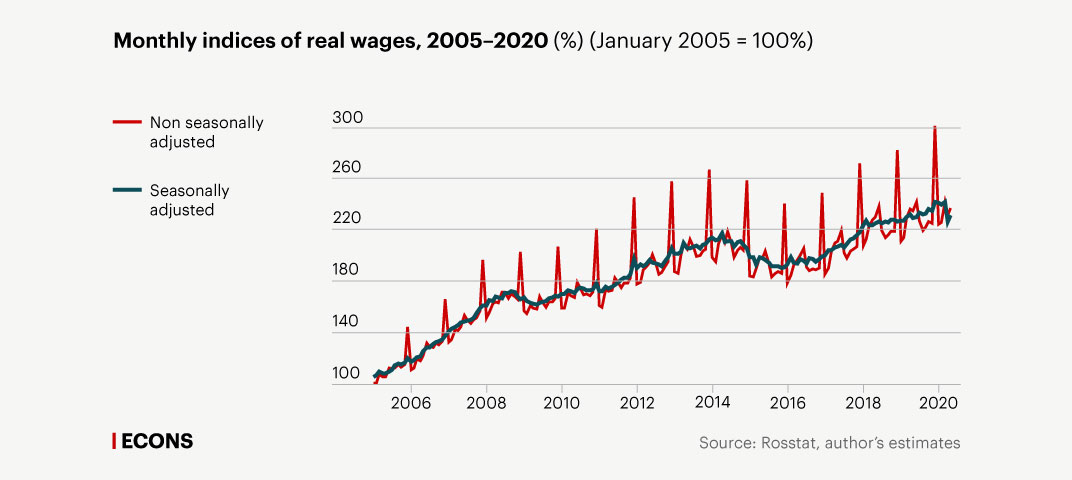
It is worth adding that a distinguishing feature of wages in Russia has always been their high downward flexibility. April 2020 gave a good illustration of this phenomenon: we estimate that real wages fell by 6.3% (we control for seasonal factors and take into account the impact of irregular factors such as lockdown), which is almost the same as the drop in wages over the entire period of the 2008–2009 crisis (see Figure 1). Given the 0.8% growth in the Consumer Price Index this month, this means that, at the onset of the crisis, Russian companies cut nominal wages by more than 5%.
This makes it clear why, in the Russian labour market, the economic turmoil has resulted in lower wages and reduced working hours rather than decreased employment and growth in unemployment. In other words, price and time adjustments prevailed over quantitative ones. The ability to reduce labour costs in one way or another made companies less motivated to dismiss workers, thus helping maintain employment and avoid sharp jumps in unemployment.

The official data seem to confirm that this time, the Russian labour market has stayed true to itself and there has been no record growth in unemployment since the beginning of the current crisis. According to Rosstat's labour force surveys, from March to June 2020, Russia’s economy saw a 1.8% decline in employment and a 1.5 p.p. increase in overall unemployment, from 4.7% to 6.2%. We see the same pattern if we compare Q2 2020 with Q2 2019: employment decreased by 2.1%, and unemployment increased by 1.4 p.p. There seems to be no sign of disaster.
What is wrong with the current overall unemployment
Labour statistics measures unemployment in two main ways. The first (primary) one is by using the data provided by sample labour force surveys, which the national statistical agencies of different countries conduct on a monthly or quarterly basis. Under this method, the unemployed are those who: a) do not have a job, b) are looking for one, and c) are ready to start working immediately. This is overall or ILO unemployment because it is measured in accordance with the methodological guidelines developed by the International Labour Organization (ILO).
The second method (minor) is by the number of people registered with the employment services. In this case, all those registered with the labour exchange and having unemployed status are considered unemployed.
Overall and registered unemployment are two different indicators that are calculated in different ways and may provide very different estimates. For example, it is obvious that the lower the unemployment benefits are, the less job seekers are motivated to register with the employment services. International statistics unequivocally recognises the overall unemployment indicator (calculated in accordance with the ILO methodology) as more accurate and methodologically more correct; this is the indicator we mentioned above.
However, the introduction of lockdown in Russia made it physically impossible to conduct labour force surveys through personal interviews, the standard method Rosstat follows. Rosstat was forced to switch to telephone surveys with a modified sampling method and seriously reduced the number of questions. As a result, estimates made before and after the beginning of the crisis turn out to be incomparable, such that they give no idea of how the coronavirus shock has actually affected employment and unemployment. We should acknowledge that the measurement errors caused by modifications to survey methods in extreme circumstances are quite real and may be significant.
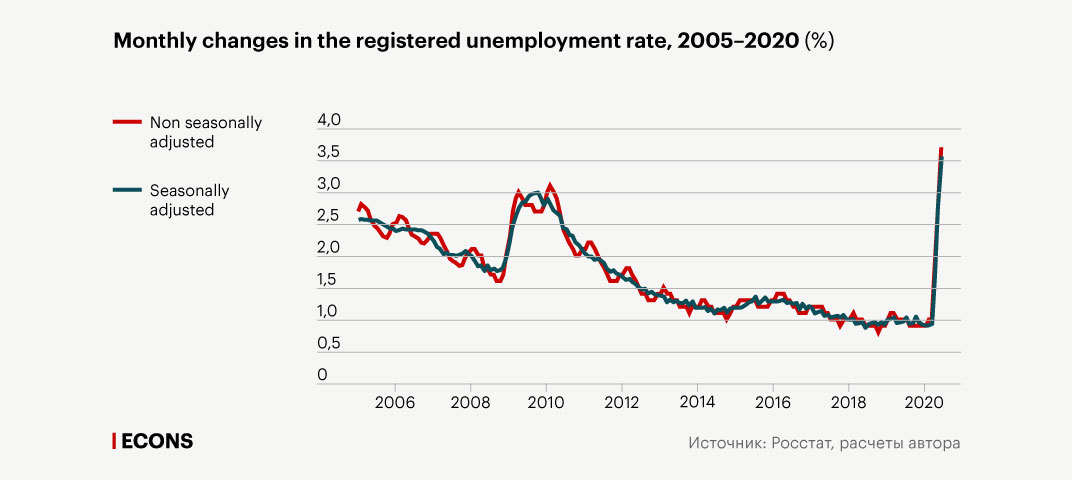
In these conditions, some propose filling in the data gap using an alternative indicator, the registered unemployment rate. In the second quarter of 2020, it grew tremendously, almost fourfold, from 1% in March to 3.7% in June. The Russian market has never seen such a dramatic jump in registered unemployment in its history. For reference, at the trough of the 2008–2009 crisis, registered unemployment increased only 1.8 times (see Figure 2).

Before the crisis, the ratio between registered and overall unemployment was about 1:5 (1% to 4.7%). Assuming that this ratio did not change when the crisis began, we can estimate the overall unemployment rate at about 18%, an astronomical figure, far higher than the record unemployment of the late 1990s. On the other hand, the ratio could well have changed, because, wary of the growing tension in the labour market, the government has made many adjustments to the unemployment support system (see more details below). If, as a result, the ratio between the two unemployment indicators changed to 1:4, then the ILO unemployment has increased to 15%; if the new ratio is 1:3, then the ILO unemployment is 11%, and so on. In this case, we are talking double-digit figures, and the highest of them suggests that, during the first months of the crisis, employment fell by almost twice as much as GDP did.
In such a case, the employment and unemployment situation seems to be a tinderbox indeed, making the forecasts about dramatic developments in the labour market more credible.
Registered unemployment: an indicator with peculiarities
But should we rely on alternative estimates? Are there reasons to believe that they better describe the current state of the labour market? Closer scrutiny reveals that arithmetic manipulations of the registered unemployment indicator make little sense and provide no ground-breaking information about labour market behaviour.
It is clear that taking the registered unemployment as a starting point makes sense only if there is a stable ratio between it and overall unemployment with little variability over time. However, this assumption is contrary to everything we know about the Russian labour market.
There has always been a huge gap between overall and registered unemployment, reaching two- to sevenfold in some periods. If we try to evaluate current overall unemployment using these ratios, we get estimates varying from 7% to 26%. This range includes figures to fit every taste, from sky-high to quite moderate, which means that the whole method is pointless.
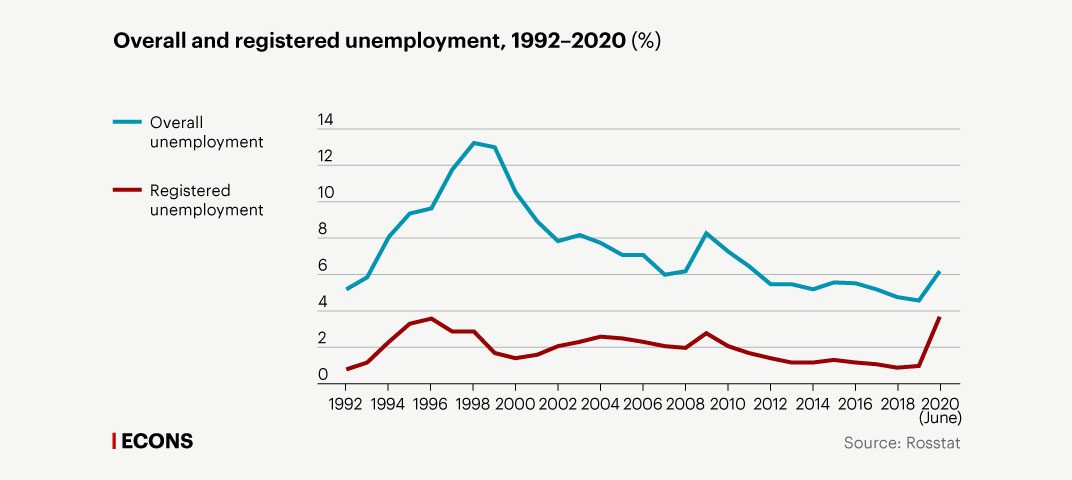
Moreover, over the past decades, overall and registered unemployment fluctuations have clearly been misaligned (see Figure 3). For example, overall unemployment peaked in 1999, while registered unemployment had reached its maximum three years earlier, in 1996. In other words, the number of registered unemployed began to decline while the number of unemployed calculated in accordance with the ILO guidelines was still growing. And the other way round, throughout the 2000s, it was often the case that, despite a steady decline in the number of ILO unemployed, the number of registered unemployed began to suddenly increase.

Figure 3 shows that, just before the current crisis, the two unemployment rates were quite seriously misaligned, and registered unemployment could grow freely, having a marginal effect on overall ILO unemployment. This is the scenario that has materialised.
The thing is that, since the beginning of the coronavirus crisis, the government has overhauled the entire unemployment support system, making it much more generous:
- The minimum unemployment benefit has increased threefold (from 1,500 to 4,500 rubles), and the maximum benefit has grown by 50% (from 8,000 to 12,150 rubles); combined with regional coefficients and allowances (as, for example, in Moscow or the Kemerovo region), the total amount can reach 20,000 rubles;
- Anyone fired after March 1 now receives the maximum unemployment benefit regardless of his or her former wage;
- Unemployed parents now receive an additional allowance of 3,000 rubles for each dependent child; when this allowance was announced, parents who did not really need jobs rushed to employment centres just to get the money;
- The maximum period of entitlement has increased by 50%, from 6 to 9 months;
- Self-employed entrepreneurs who went out of business are now entitled to the maximum unemployment benefit (before the crisis, they could apply for the minimum benefit at best);
- An electronic registration system has been introduced;
- After the introduction of lockdown measures, the unemployed became exempt from the mandatory, twice-monthly, in-person renewal of their unemployment registration with the employment centres.
All in all, the financial incentives to register with the employment services have increased dramatically, it has become less onerous to acquire and keep official unemployed status, and the period of entitlement to unemployment benefits has increased.
The government’s measures indicate that this time, it is poised to use the first channel of social support in a more active way through the unemployment insurance system (of course, it has not forgotten to subsidise underemployment with a view to minimising redundancies).
These dramatic changes in the incentives were bound to accelerate growth in the number of registered unemployed, no matter what was going on with overall unemployment at the time.
Testing the unemployment indicators
We can quantify the contribution of one of the factors, i.e., changes in the number of de-registrations from the employment services. For instance, at the trough of the 2008–2009 crisis, the decrease rate of the number of registered unemployed reached almost 15%, while during this crisis, it has fallen to 5% as a result of the increased entitlement period, online registration renewal instead of in-person, etc. This alone may have increased the total number of registered unemployed by roughly 500,000–600,000 people.
The composition of the inflow has changed as well. Before the crisis, the proportion of long-time unemployed and the never-employed was from one-fourth to one-third of all registered unemployed, now they account for about 50%. At the same time, people who have lost their jobs account for only 25%. In other words, the unprecedented surge in registered unemployment is attributable to a sharp increase in the number of economically inactive persons registering with the employment services, rather than in the number of formerly employed.
All this suggests that after the basic parameters of the unemployment support system were changed, registered unemployment became a ‘contaminated’ indicator, giving little idea of how the economic crisis has impacted employment. Until the early fourth quarter of 2020 at the very least, changes in the number of registered unemployed are likely to correlate weakly with the real state of the labour market.
We can offer another, indirect, test. As is known, various labour market indicators tend to show common trends, negative during contraction, and positive during expansion. If an almost fourfold increase in registered unemployment reflects labour market deterioration, it is reasonable to expect similar changes in other market indicators.
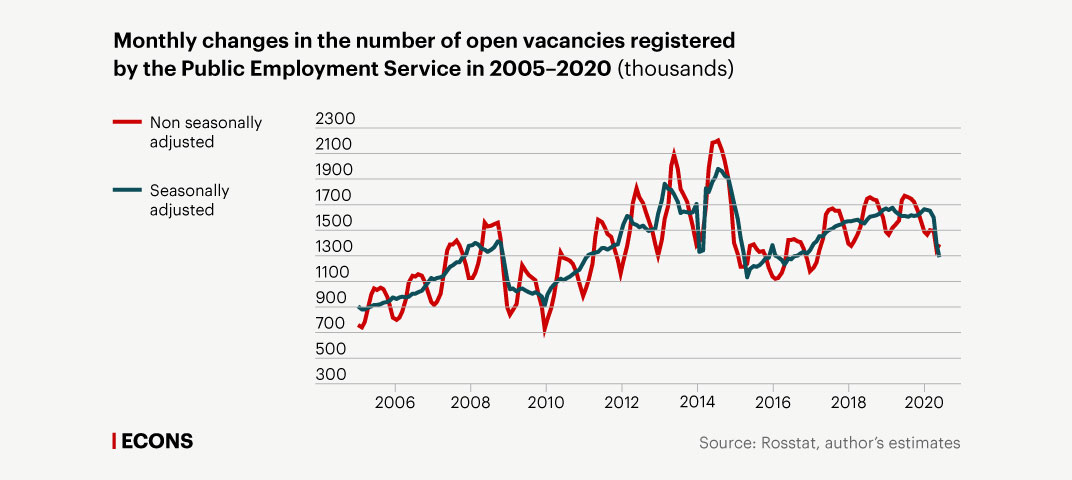
Let us limit ourselves to two examples. The first is the number of vacancies registered by PES. In April and May 2020, it fell by 10%, which is in line with its regular seasonal fluctuations (see Figure 4). This all-too-modest decline barely corresponds to the explosion in registered unemployment. For reference, at the trough of the 2008–2009 crisis, the number of vacancies registered by PES dropped by 40%! However, this indicator is apparently more informative than registered unemployment: the unemployment registration and support system underwent profound changes during the corona crisis, while the vacancy registration system remained the same and, as a result, was immune to the distortions that registered unemployment suffered due to the recent legislative initiatives.

The second example is the number of employees working in large and medium enterprises. At the trough of the 2008–2009 crisis, the monthly decrease in the number of employees on the payroll of large and medium enterprises reached 1%. In April-May 2020, it did not exceed 0.2-0.5% (seasonally adjusted). These moderate staffing cuts, within the range of seasonal fluctuations, in a crucial sector of the Russian economy, again, do not correlate with the almost fourfold jump in the number of registered unemployed.
In other words, everything points to the fact that the registered unemployment obfuscates the reality of the labour market, rather than clarifies the picture.
Nevertheless, there is an empirical phenomenon that has been more stable over time. In the Russian labour market, employment has always had extremely low output elasticity. Estimates show that, during the 1990s transition crisis, it was 0.35, i.e., every percentage point of GDP drop was accompanied by a one-third of one percentage point decrease in the number of employed persons. During the 2008–2009 crisis, it fell to 0.25, i.e., every percentage point of GDP drop was accompanied by a one-fourth of one percentage point decrease in the number of employed persons.
If we build upon the estimated 10% decrease in GDP in the second quarter of 2020, then the expected employment response will be about -2.5%, and, correspondingly, an increase in total unemployment of about 2 p.p. (since some of those who lose their jobs become economically inactive instead of unemployed).
These estimates are, firstly, well in line with the general patterns of the Russian labour market; secondly, they correspond to the changes in many other market indicators during the current crisis; and thirdly, they do not deviate much from the official statistics. And if they are more or less true to reality, then there has been no record rise in unemployment due to the coronavirus shock, and given how things are going, there will be none.


