Precarious Prosperity
Public debate on inequality usually focuses on statistical indicators evaluating income distribution, such as the widely-used Gini coefficient. However, it is worth keeping in mind that certain people can switch income groups, exchanging their places in the income distribution: with some gaining, and others losing, some part of their income. This income mobility can aggravate or, by contrast, mitigate social inequality.
For instance, higher income mobility might suggest higher equality of opportunity to join top income groups. It facilitates social cohesion, and in this case, income inequality can stimulate productivity growth. At the same time, high income mobility shows how unstable social status is.
To evaluate income mobility, one can estimate the number of people who change income groups over a specific period. In our research, we monitor transitions between quintiles, five equal groups of population determined based on income levels. Thus, the lower quintile includes the 20% of Russians with the lowest incomes, while the upper one includes the 20% with the highest incomes. This analysis is based on the data provided by the HSE Russian Longitudinal Monitoring Survey ( RLMS-HSE).
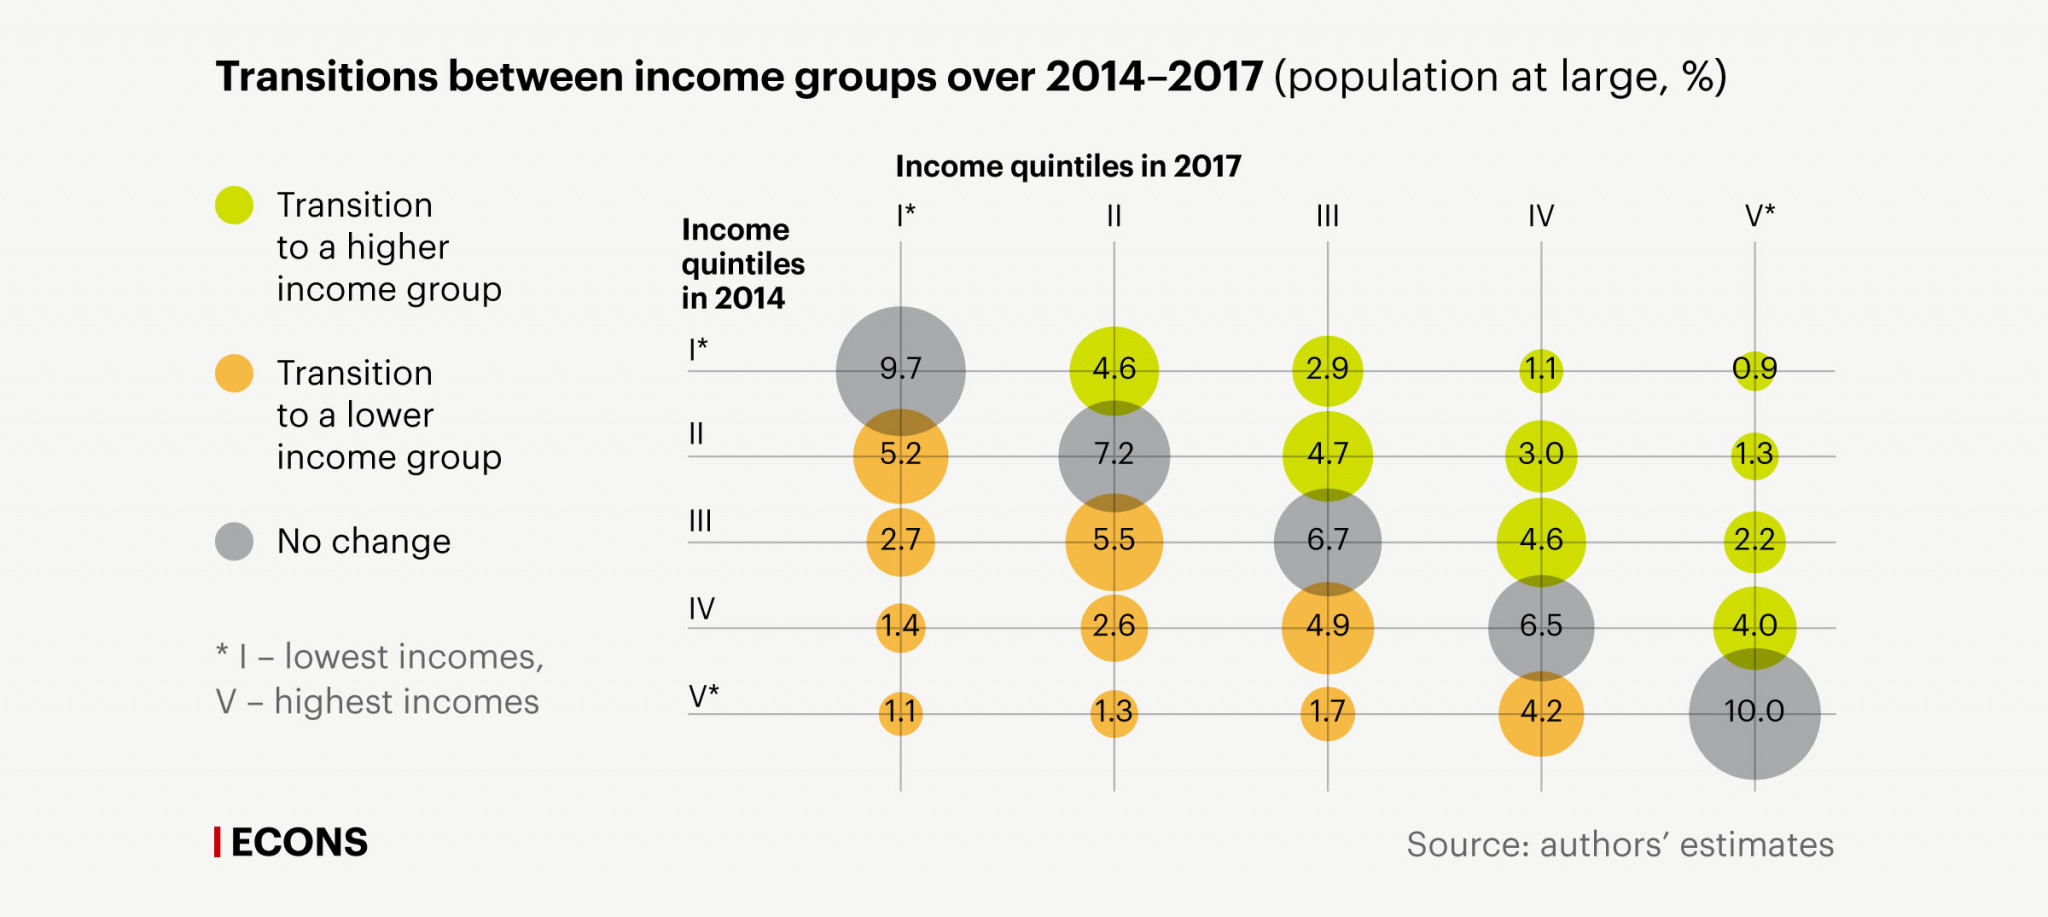
The general scale and directions of individual income mobility in Russia are shown in the chart “Transitions between income groups over 2014-2017”; the data demonstrates changes in income distribution in 2017 compared to 2014.
Transitions between income groups over 2014–2017 (population at large, %)
Transition to a higher income group
Transition to a lower income group
No change
Income quintiles in 2017
Income
quintiles
in 2014
III
IV
I*
II
V*
I*
9.7
2.9
0.9
4.6
1.1
II
5.2
7.2
4.7
3.0
1.3
III
2.7
6.7
2.2
5.5
4.6
IV
1.4
2.6
4.9
4.0
6.5
V*
1.1
1.3
4.2
10.0
1.7
* I – lowest incomes, V – highest incomes
Source: authors’ estimates
Transition to a higher income group
Transition to a lower income group
No change
Income quintiles in 2017
Income
quintiles
in 2014
I*
II
V*
III
IV
I*
9.7
4.6
2.9
1.1
0.9
II
5.2
7.2
4.7
3.0
1.3
III
2.7
6.7
2.2
5.5
4.6
IV
1.4
2.6
4.9
6.5
4.0
V*
1.1
1.3
1.7
4.2
10.0
* I – lowest incomes, V – highest incomes
Source: authors’ estimates
Transition to a higher income group
Transition to a lower income group
No change
Income
quintiles
in 2014
Income quintiles
in 2017
I*
II
III
IV
V*
I*
9.7
4.6
2.9
1.1
0.9
II
5.2
7.2
4.7
3.0
1.3
III
2.7
5.5
6.7
4.6
2.2
IV
1.4
2.6
4.9
6.5
4.0
V*
1.1
1.3
1.7
4.2
10.0
* I – lowest incomes, V – highest incomes
Source: authors’ estimates

Mobility in Russia can be considered rather high in comparison with OECD data. This is more common for economies in transition, where people’s income status is unstable.
Sticky floor and sticky ceiling in Russia
Russia, like other countries, has a “sticky floor” and a “sticky ceiling”: the income status of members of the lowest and the highest quintiles proves the most stable, i.e. the composition of the lowest and the highest income groups changes the least (it is worth noting that the analysis focuses on mass groups covered by surveys and excludes the top 3-5%). For example, about half of Russians included in the first and fifth quintiles in 2014 remained in these groups in 2017.
However, over these four years, the lowest and the highest income groups were less stable in Russia than in the OECD countries on average, which is yet another sign of higher income mobility in Russia. At the same time, the 9-year trend shows that the income mobility of the lower-income group is similar to the OECD countries. However, there are still fewer Russians “sticking to the ceiling”, which means that in Russia, prosperity is less persistent than in other countries.
A more detailed analysis of the directions of mobility emphasizes the instability of income status in Russia: if one looks at the changes within this period, rather than simply comparing 2014 with 2017, almost half of the population appears to have transitioned to both higher and lower income quintiles.
The factors that prevent people from working their way out of the lower quintiles, or from guaranteeing their place in the upper ones, add to the picture. Demographic profiles and family structures (especially the presence of children or other dependents, which increases poverty risks) have a strong bearing on the situation. This certainly needs to be considered by social and economic policymakers. The situation in the labour market, too, affects the way the “sticky” areas form. The “floor” usually consists of low-paid employees and people with less secure jobs, while the “ceiling” consists of qualified white-collar workers with secure jobs and steady high incomes, whose professions allow them to keep working even after retirement.
These mobility patterns raise questions about the need to mitigate ascriptive inequalities, i.e. those which are “predetermined”, having no objective relation to the efforts a person makes (for example, one’s background or place of birth). For instance, these questions include reducing the poverty of children born into rural families or those with many children. Moreover, it is necessary to create an institutional environment that can stabilize the incomes of average Russians, i.e. improve social security in the labour market and compensate temporary or situational losses of income (for example, in the events of a job loss or an illness).
Perceptions of prosperity
A comparison between real and perceived income mobility (the way people answer questions about their social status and changes in it) adds to the picture. Data collected by RLMS-HSE allowed the application of the mobility evaluation technique to the data on perceived place on the rich-poor scale (9 gradations, out of which 1 signifies very poor and 9 signifies rich).
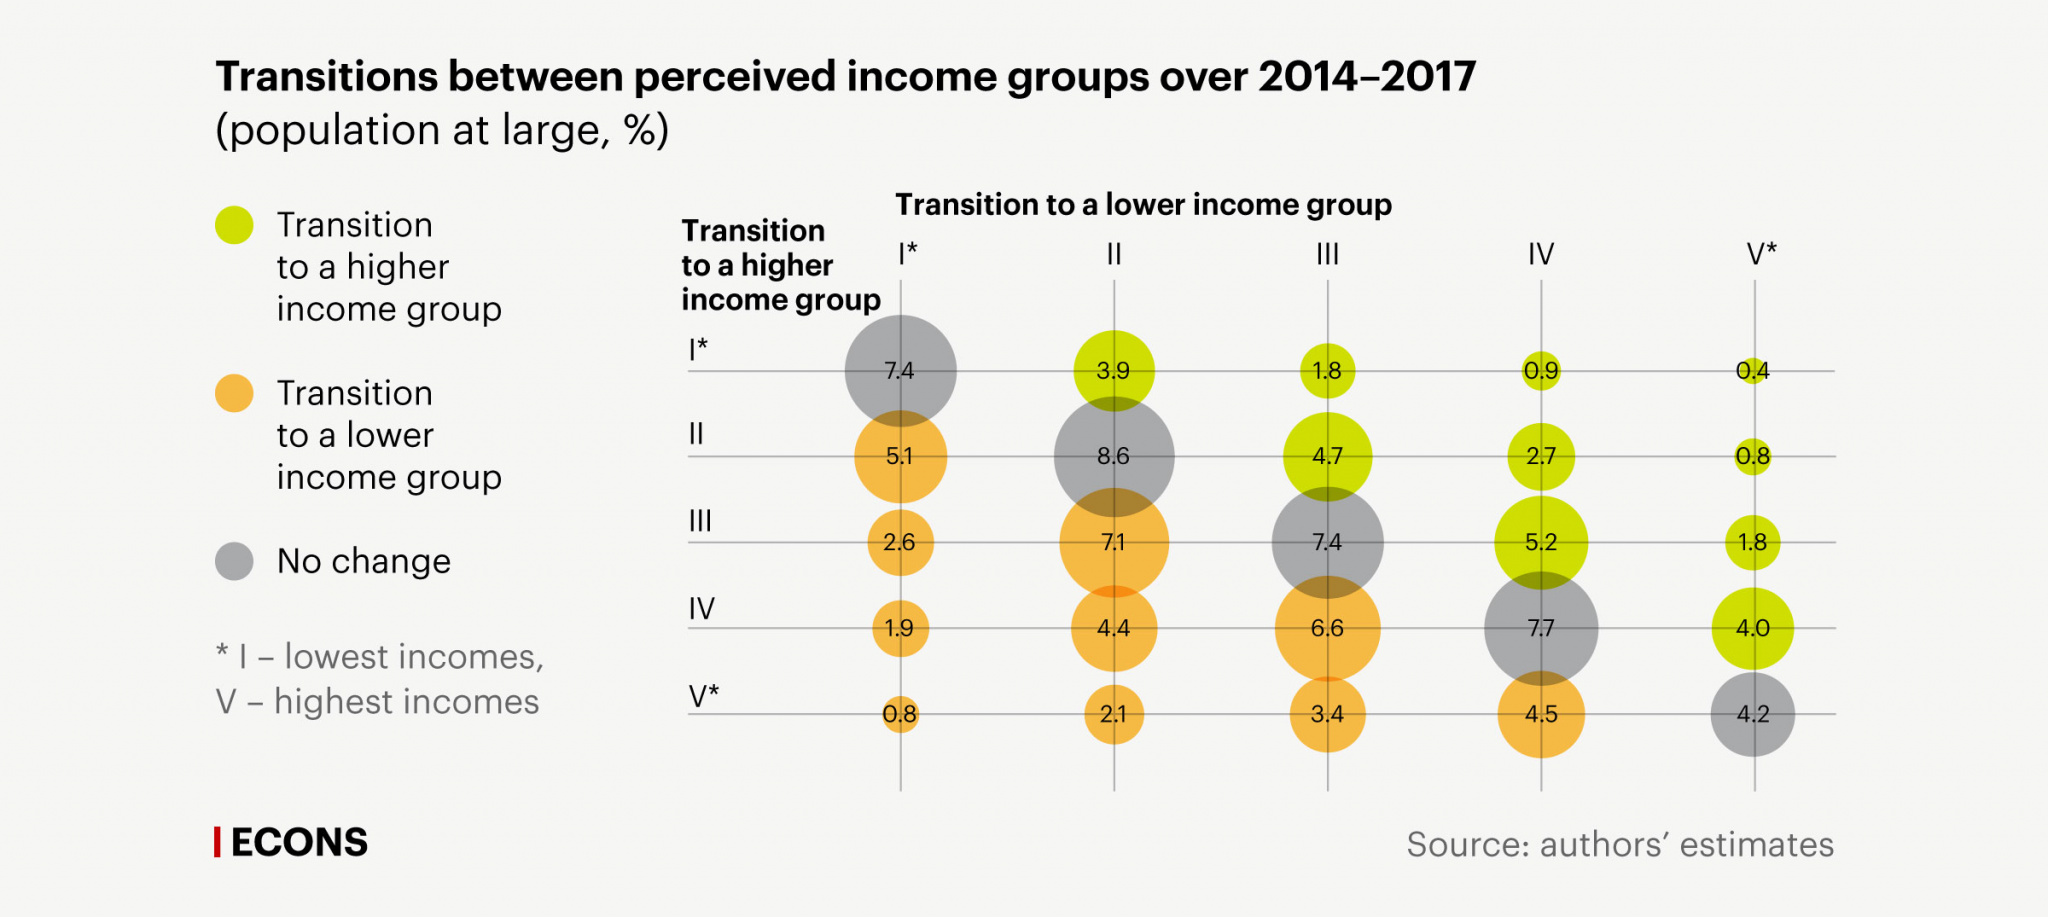
One’s perceived place on the rich-poor scale has proven to be even more volatile than real income status (see the chart below). In other words, people’s perceived income status in relation to others is even less stable than their actual income status. At the same time, these are the perceptions that determine one’s subjective satisfaction or dissatisfaction with one’s position and, as a result, one’s social and psychological state, and the potential for social tensions or even a demand for a new social contract.
Transitions between perceived income groups over 2014–2017
(population at large, %)
Transition to a higher income group
Transition to a lower income group
No change
Income quintiles in 2017
Income
quintiles
in 2014
III
IV
I*
II
V*
I*
7.4
3.9
0.9
1.8
0.4
II
5.1
8.6
2.7
0.8
4.7
III
2.6
7.1
7.4
5.2
1.8
IV
1.9
4.4
6.6
4.0
7.7
V*
0.8
2.1
3.4
4.5
4.2
* I – lowest incomes, V – highest incomes
Source: authors’ estimates
Transition to a higher income group
Transition to a lower income group
No change
Income quintiles in 2017
Income
quintiles
in 2014
I*
II
V*
III
IV
I*
7.4
3.9
0.9
1.8
0.4
II
5.1
8.6
2.7
4.7
0.8
III
2.6
7.1
5.2
7.4
1.8
IV
1.9
4.4
7.7
6.6
4.0
V*
0.8
2.1
4.5
3.4
4.2
* I – lowest incomes, V – highest incomes
Source: authors’ estimates
Transition to a higher income group
Transition to a lower income group
No change
Income
quintiles
in 2014
Income quintiles
in 2017
I*
II
III
IV
V*
I*
7.4
3.9
1.8
0.9
0.4
II
8.6
2.7
0.8
5.1
4.7
III
2.6
7.1
7.4
5.2
1.8
IV
1.9
4.4
6.6
4.0
7.7
V*
3.4
4.2
0.8
2.1
4.5
* I – lowest incomes, V – highest incomes
Source: authors’ estimates
Transition to a higher income group
Transition to a lower income group
No change
Income
quintiles
in 2014
Income quintiles
in 2017
I*
II
III
IV
V*
I*
7.4
3.9
1.8
0.9
0.4
II
5.1
8.6
4.7
2.7
0.8
III
2.6
7.1
7.4
5.2
1.8
IV
1.9
4.4
6.6
7.7
4.0
V*
3.4
4.2
0.8
2.1
4.5
* I – lowest incomes, V – highest incomes
Source: authors’ estimates

Persistent subjective poverty is mainly defined by two factors: “bad” jobs and health (most of all for the retired, as in the event of severe chronic illness, their already small incomes require a dramatic overhaul of their spending behavior). Enduring subjective well-being, by contrast, is typical of the youth and of qualified workers with good jobs.
At the same time, sustained subjective well-being is only weakly correlated with income well-being. The issue is that techniques of analysis based only on income have many blind spots and cannot evaluate households’ real standard of living and quality of life. In fact, it is also influenced by other factors (health, education and skills, social connections, etc.) and risks that require control (for example, compulsory medical expenses, rent, support of relatives, etc.). Secondly, perceived status is defined not only by (and not in correspondence with) real income; it is even more important how people perceive their standard of living in relation to their nearest circle, their standard of living in the past, their ambitions and aspirations, and their notion of justice.
.jpg)


