The way dividends affect company capitalisation and drive investment returns is one of the hottest and most debated subjects in financial research. US economist Fischer Black, co-creator of a Nobel Prize-winning option pricing model, compared the analysis of dividend policy to a brainteaser: the harder we look at the dividend picture, the more it seems like a puzzle, with pieces that just don’t fit together. ‘What should the individual investor do about dividends in his portfolio? We don’t know. What should the corporation do about dividend policy? We don't know’, Black wondered in 1976. It is still not fully clear today, almost half a century after the publication of Black’s article, what dividend policy is optimal for issuers and investors.
We have collected extensive empirical data on the shares of Russian issuers, of all levels of listing, on which dividends were paid at least once in the 2005 to 2023 period. The data have enabled us to identify key trends in dividend payments and the implications of this policy for investor strategies.
Historical retrospective
Over the past 10 years, dividends have emerged as an impactful driver of company capitalisation and investor decisions. This is clearly seen from both the accelerated growth in the number of dividend-paying companies and the amounts of these payments.
Over the entire period under study from 2005 to 2023, Russian companies had paid a total of 28.2 trillion rubles in dividends, of which almost 87% were payments in the past ten years (2014–2023) and 59% in the last five years (2019–2023). The past ten years saw the number of public dividend-paying issuers stabilise at around 103–146. As of February 2024, a mere 11 companies had paid dividends for the reporting year 2023.
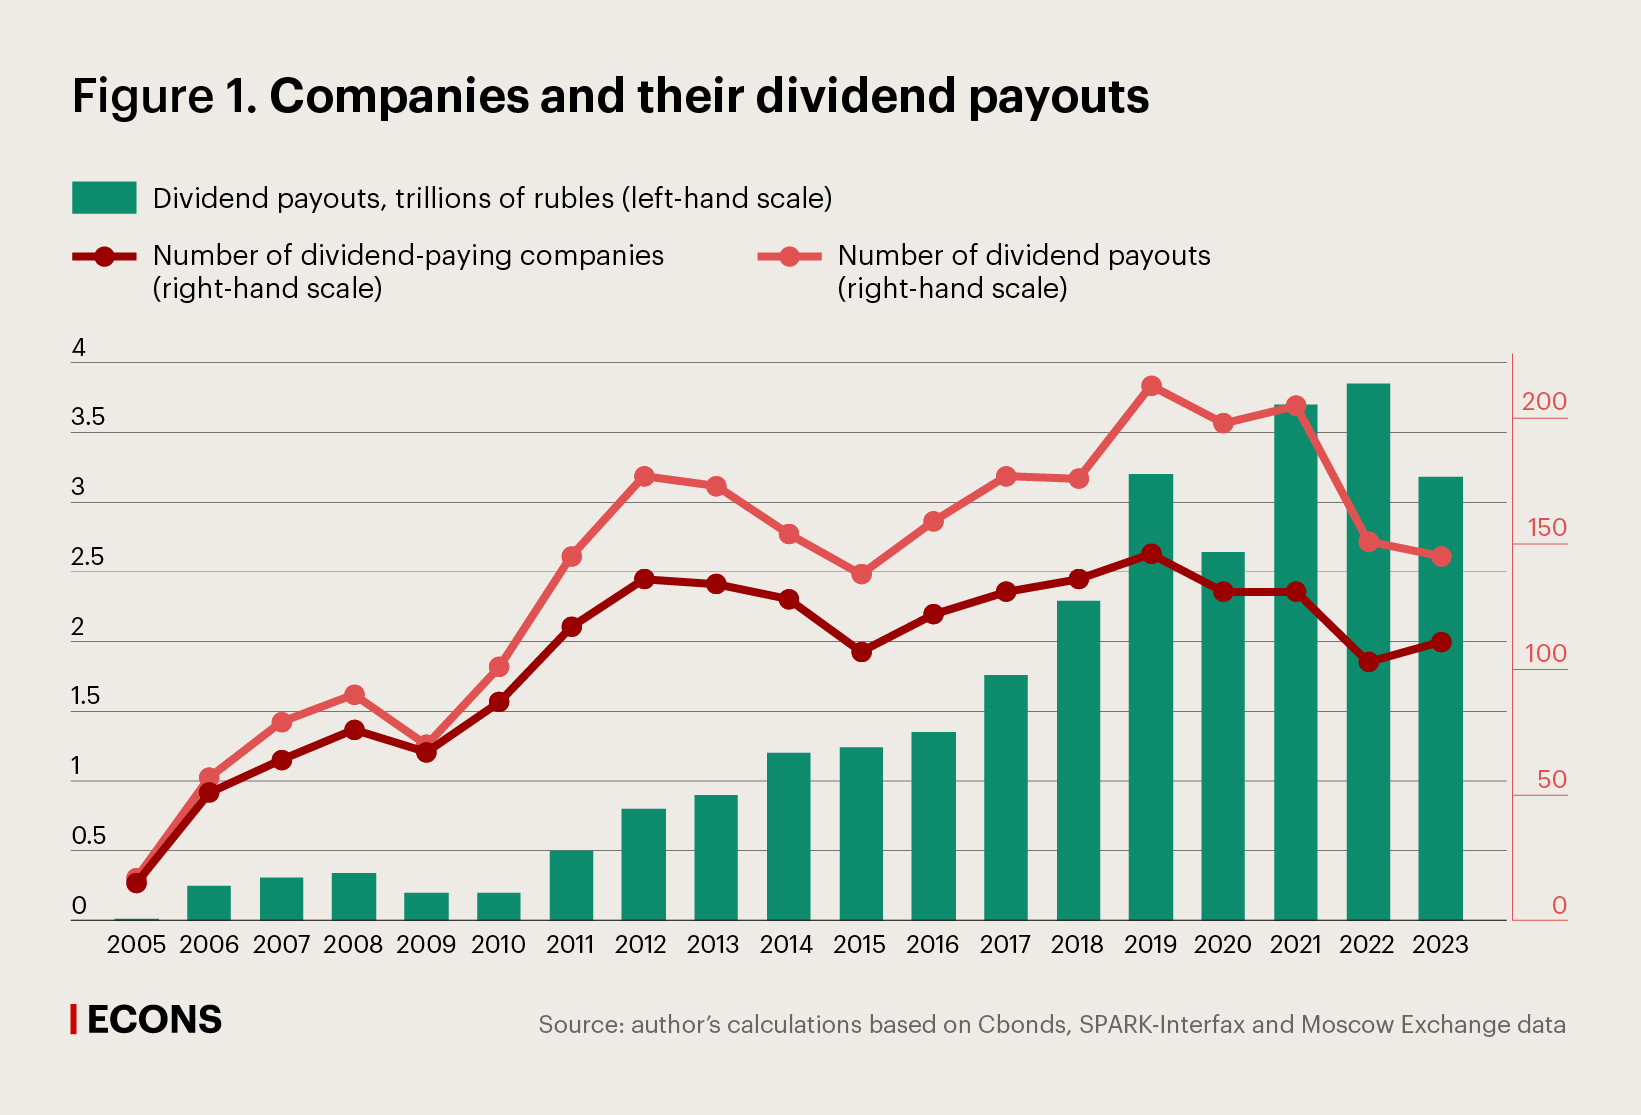
In the period under study, the growth rate of dividend payments outpaced the growth rate in the number of dividend-paying companies, a sign of a benign shift towards more regular payouts. The average number of dividend payouts per company was up from 1.2 in 2005–2013 to 1.4 in 2014–2023, and further up to 1.5 in 2019–2023. More than half of the payments were made by issuers from Level 3 of listing (previously, unlisted shares), which are marked by a low level of transparency in financial disclosures and a low proportion of shares in free float.
Listing Level 1 (previously known as the А1 and A2 Quotation List) shares sit in second place by payout frequency. These shares are subject to the most stringent disclosure, corporate governance, capitalisation and free float requirements.
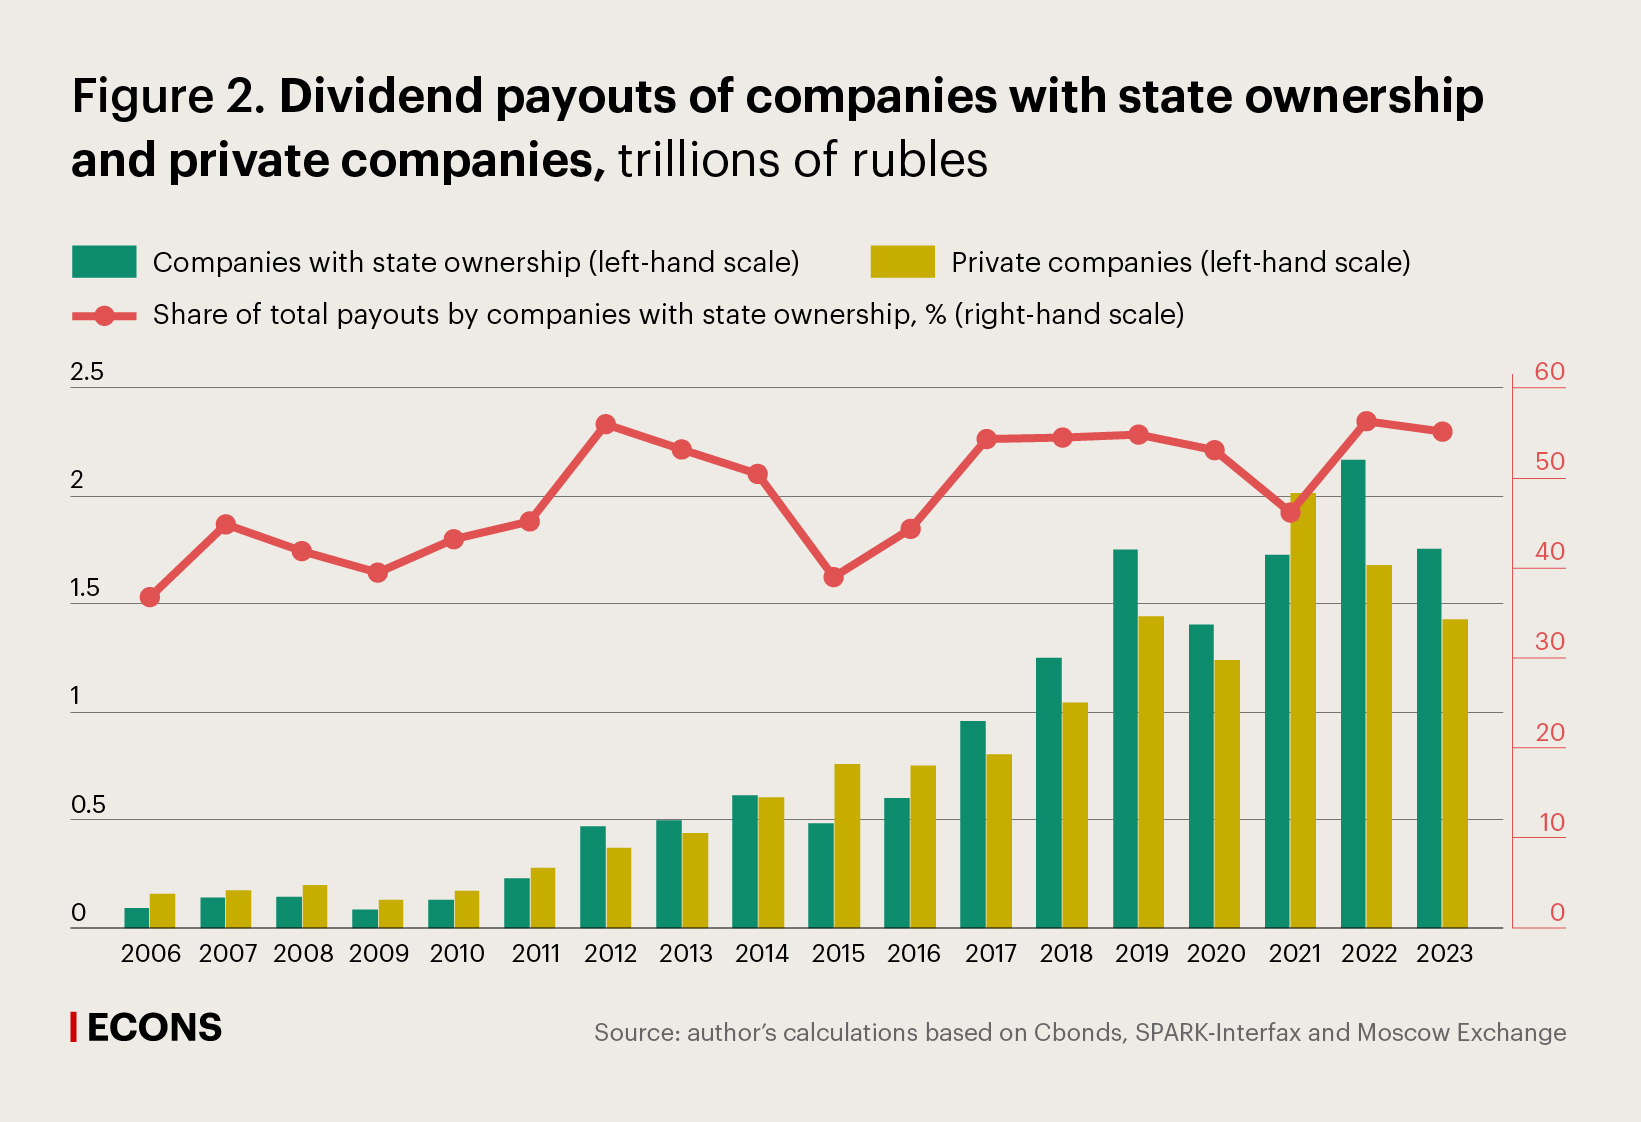
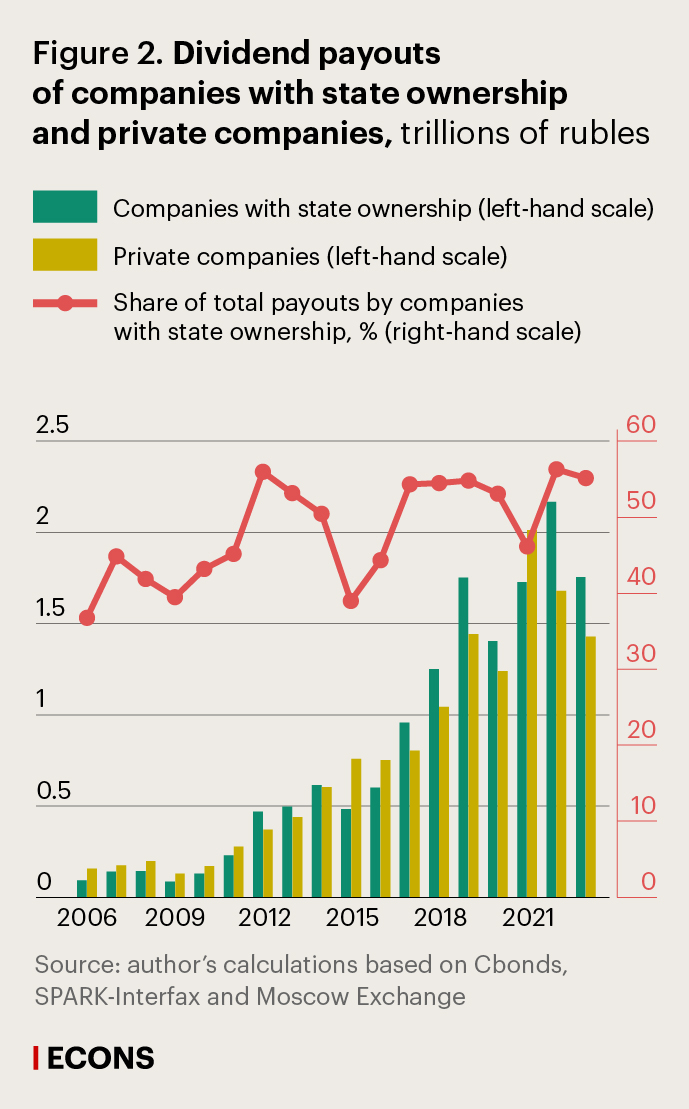
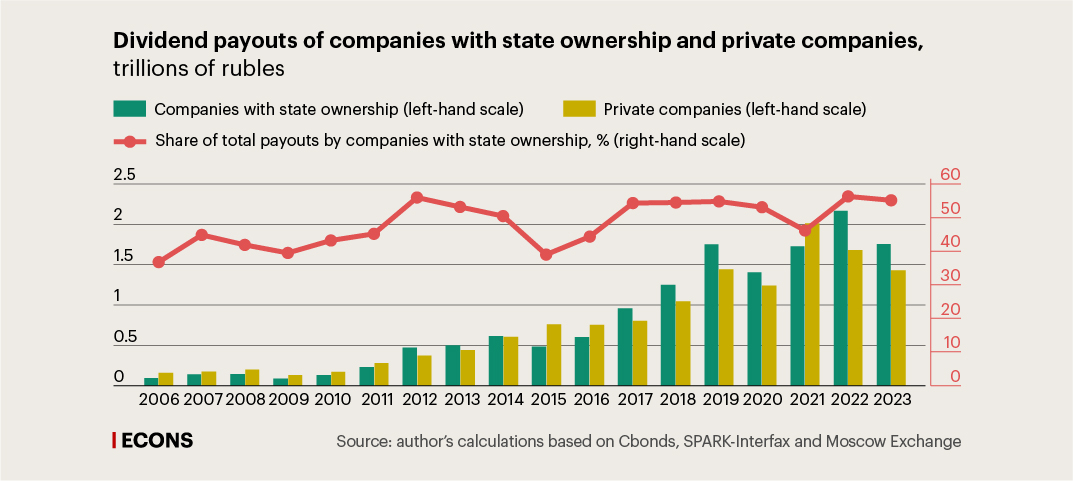
The largest proportion of dividends are paid by companies with state ownership. In 2017–2023 (with the exception of 2021, which saw the payment of dividends accrued for the first pandemic year), the proportion of dividends paid by companies with state ownership ranged between 54 and 56% of total dividend payments. This is likely a consequence of measures taken by the Russian government which stipulate (link in Russian) that large companies with state ownership must pay at least 50% of their net profits in dividends.
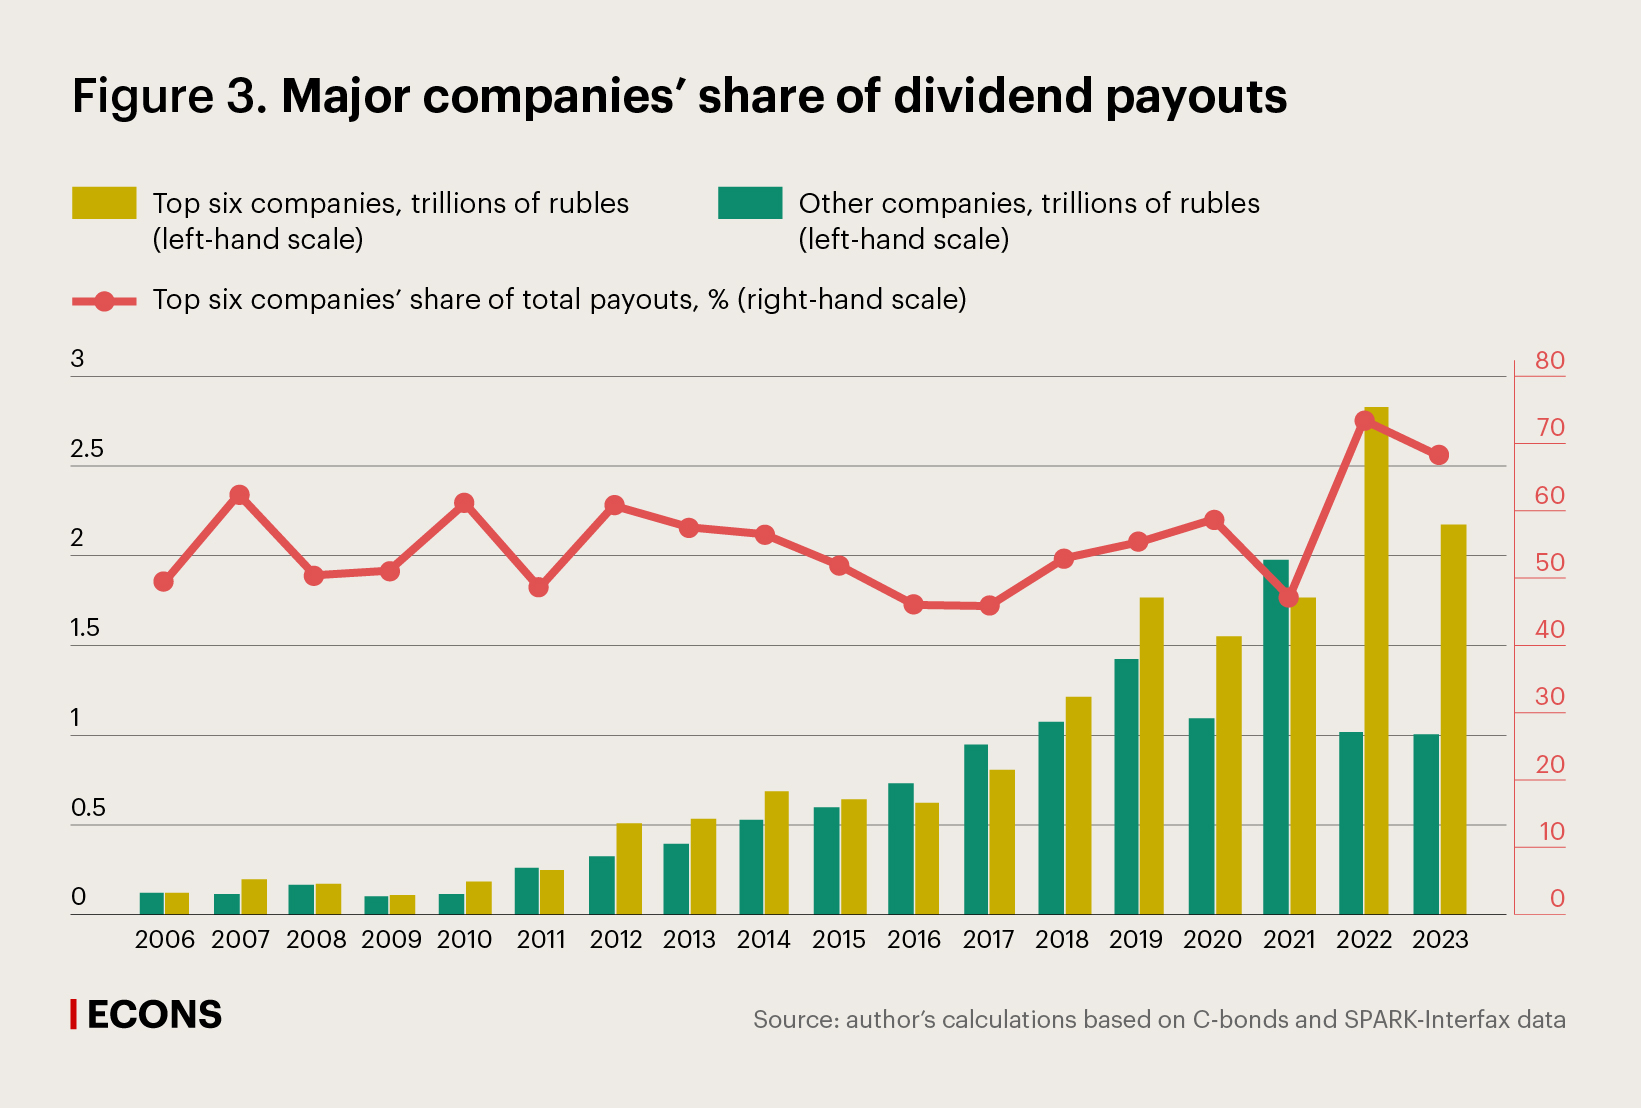
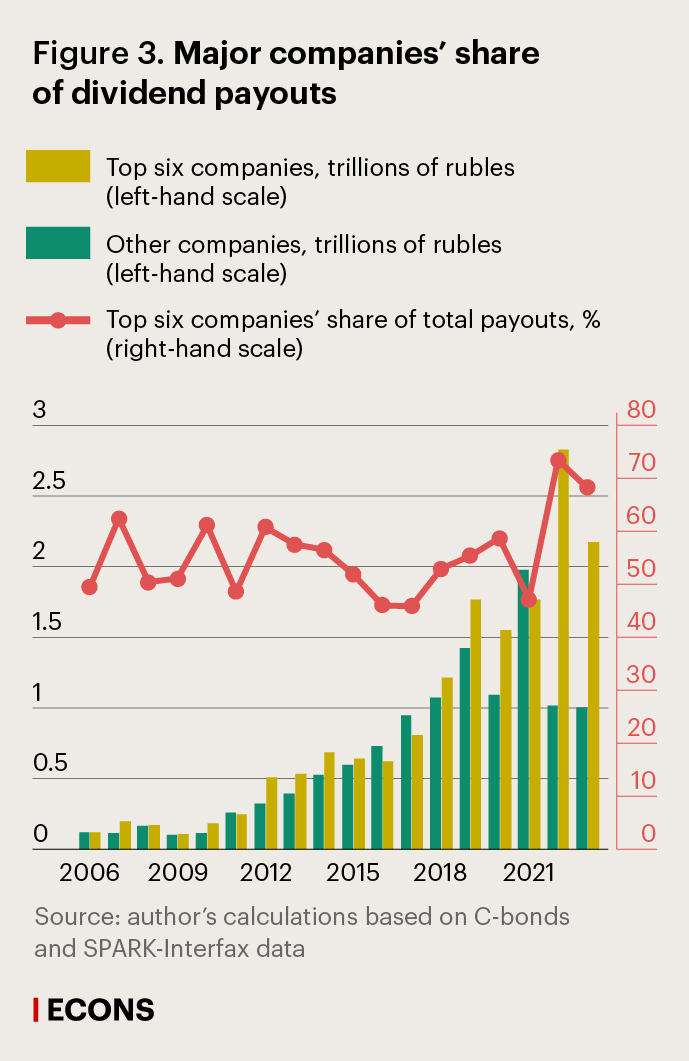
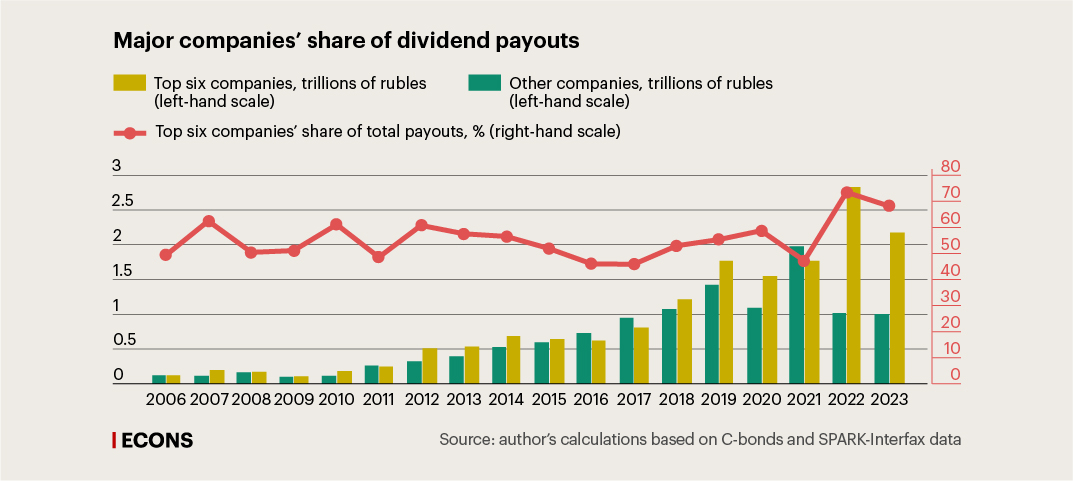
The major share of dividends were paid by a limited number of major issuers. In particular, six companies – Gazprom, Sberbank, Lukoil, Rosneft, Gazprom Neft and Norilsk Nickel – accounted for more than two thirds (68.3%) of the total dividends in 2023. The average share of these companies remained steadily high throughout the period under study and even increased from an average of 53.5% in 2006–2017 to 59.3% in 2018–2023.
Of the 205 issuers that paid dividends at least once between 2006 and 2023, free float statistics are only available for 69 shares, of which 10 are preferred stocks. These companies issued a total of 228 shares (partially ordinary, partially preferred). Market investors – whose shares are accounted for in free float stock– were paid 8.6 trillion rubles in dividends, i.e. about one third (30.4%) of the 28.2 trillion rubles paid in 2005–2023. Shareholders whose shares are not free float shares received 16.1 trillion rubles (57.2% of dividends).
Dividend yield
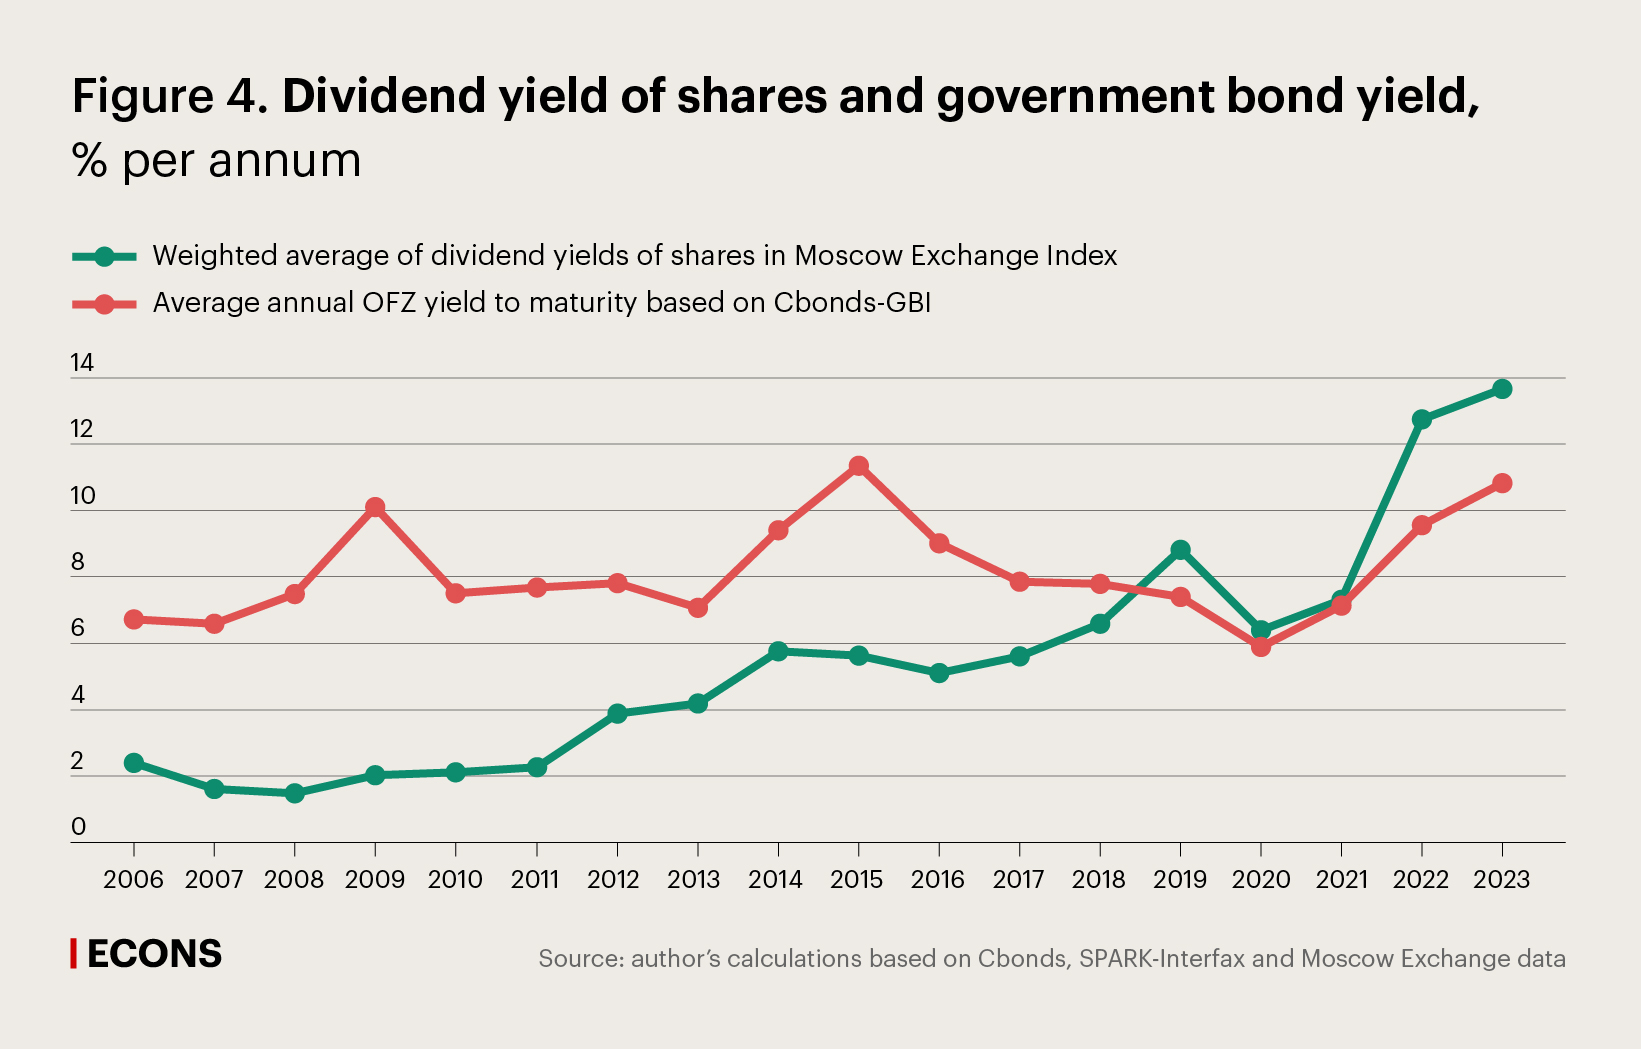
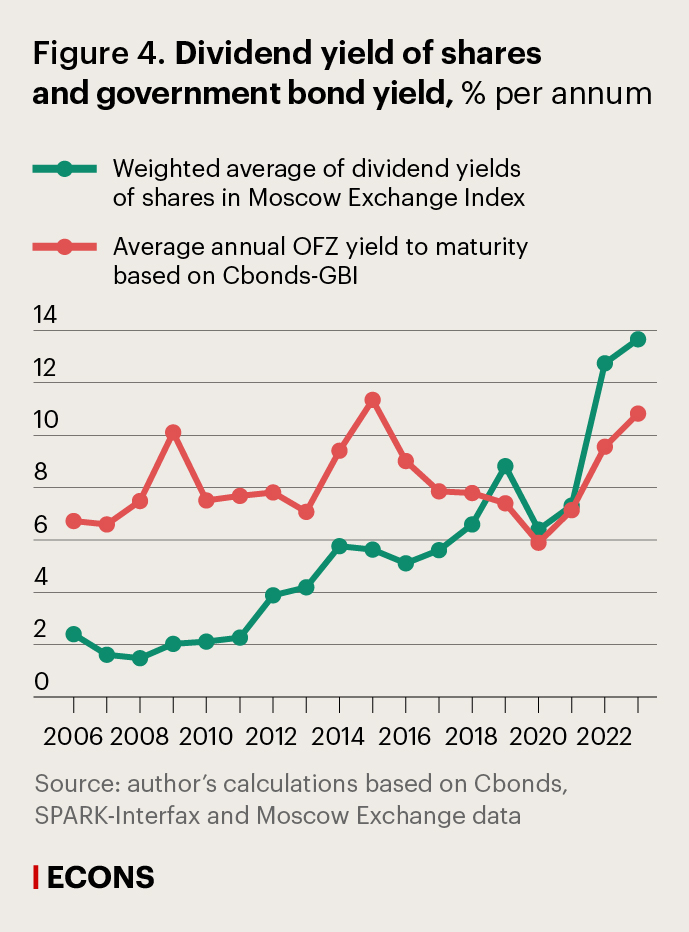
The marked rise in the dividend yield (calculated as the weighted average for issuers in the Moscow Exchange Index based on consolidated financial statements since 2012) highlights the increased role of corporate dividend policies in sustaining investment appeal.
The average dividend yield for shares included in the Moscow Exchange Index (the most liquid shares of the largest and fastest-growing Russian issuers in core sectors) grew from 2.3% in 2011 to 13.7% in 2023. At the same time, since 2019, dividend yields have exceeded the yield to maturity on government bonds included in the Cbonds-GBI index. This points to the rising appeal of stocks for investors focused on passive regular income strategies.
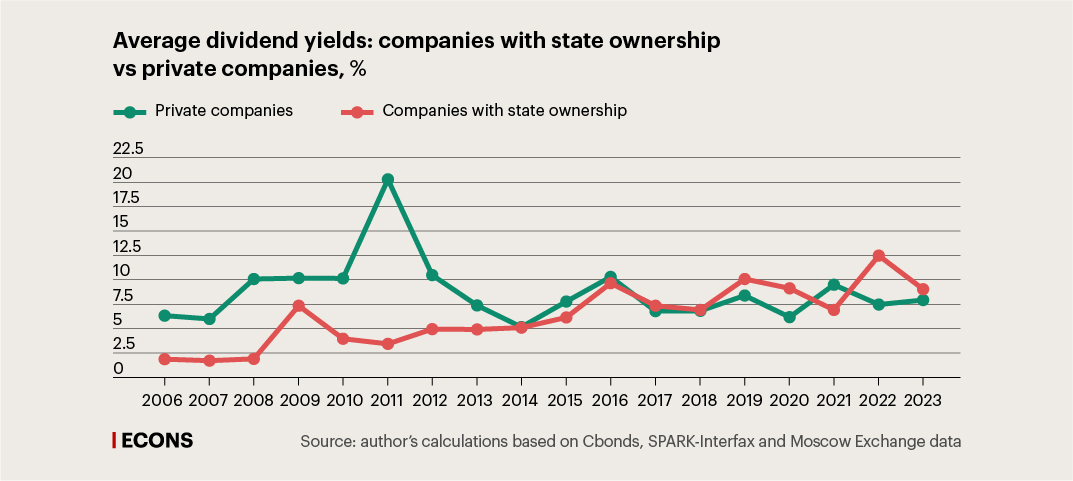
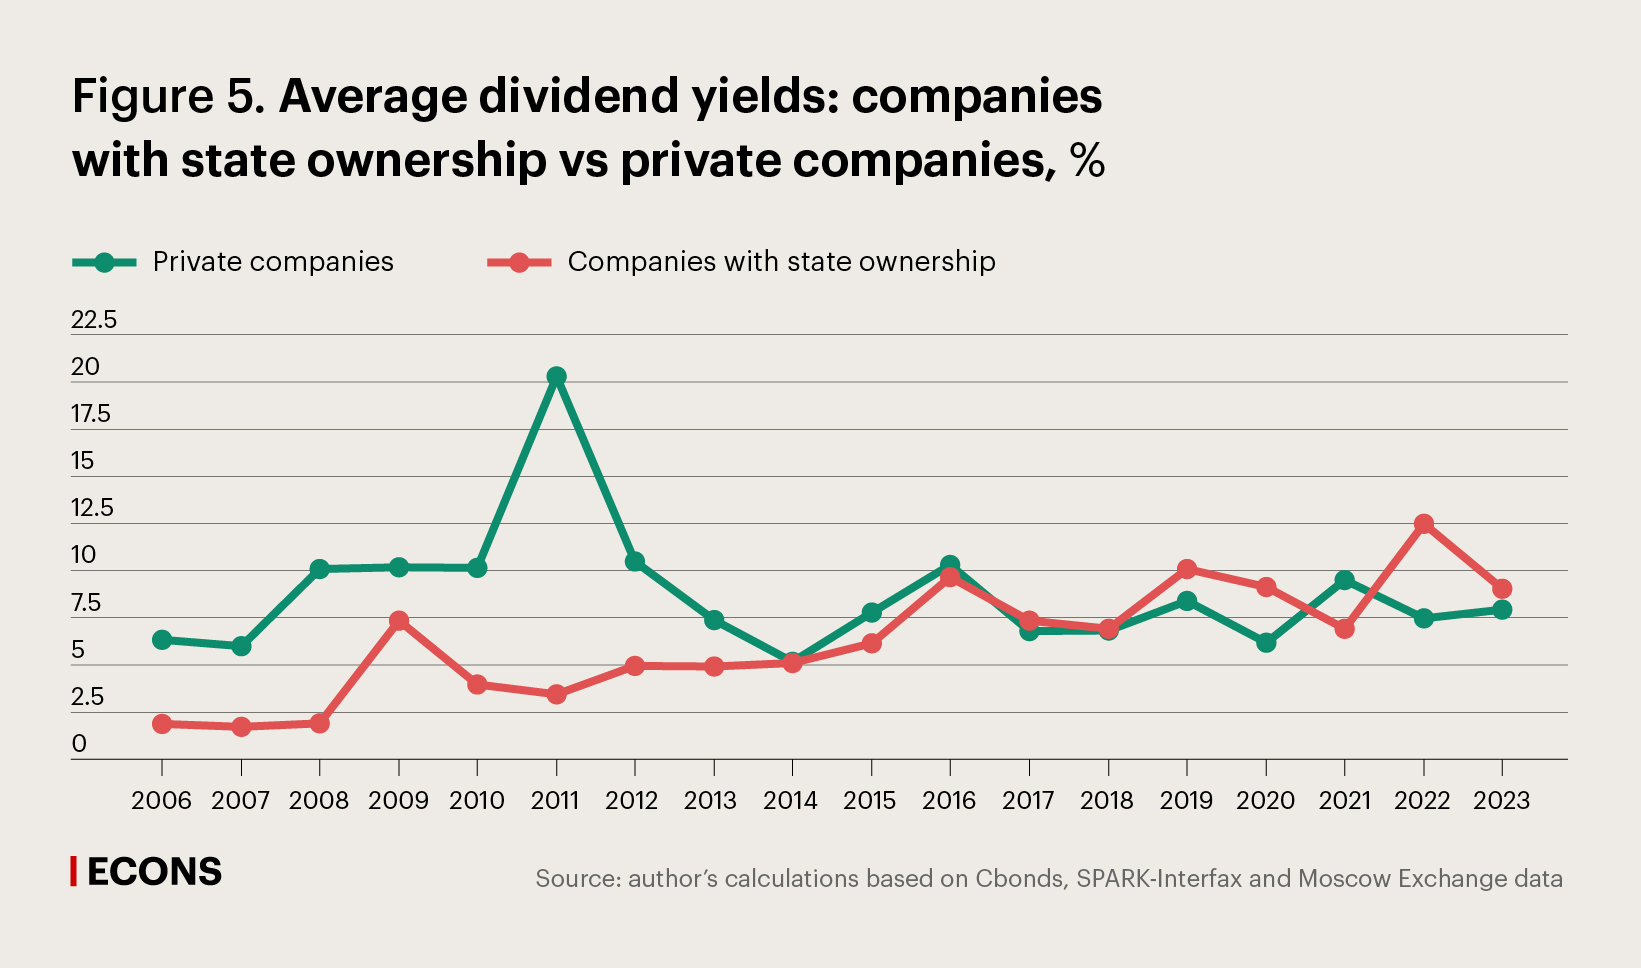
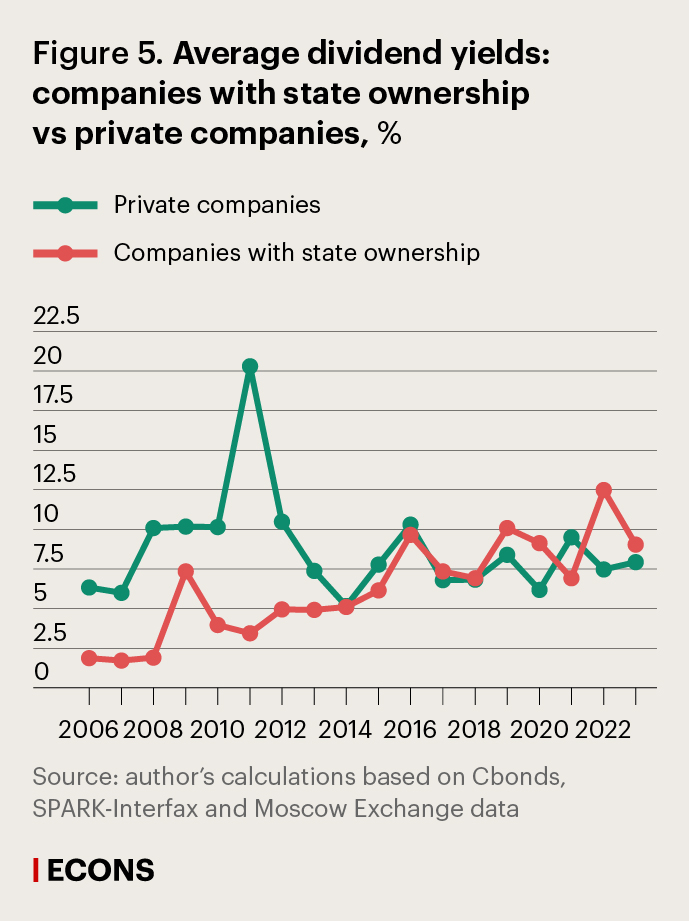
By dividend yield, companies with state ownership caught up with private firms; in 2017–2023 (except for 2021), the dividend yields of companies with state ownership were much higher than those of private issuers. This was helped by the above-mentioned Russian Government measures to incentivise the largest state-owned firms to make dividend payments.

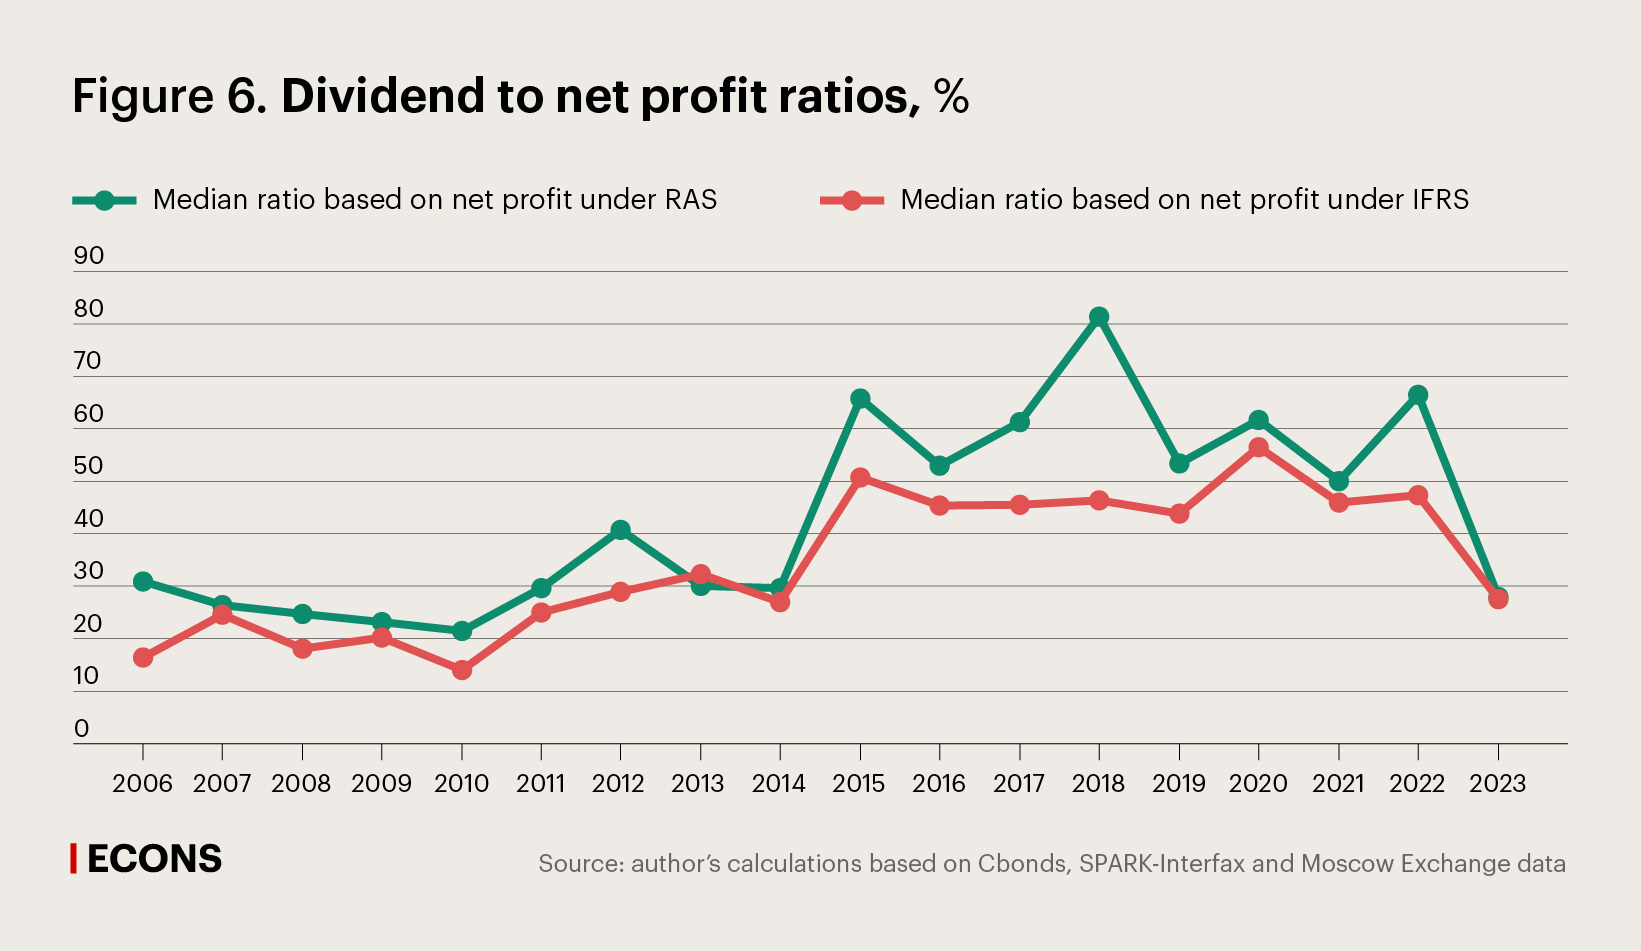
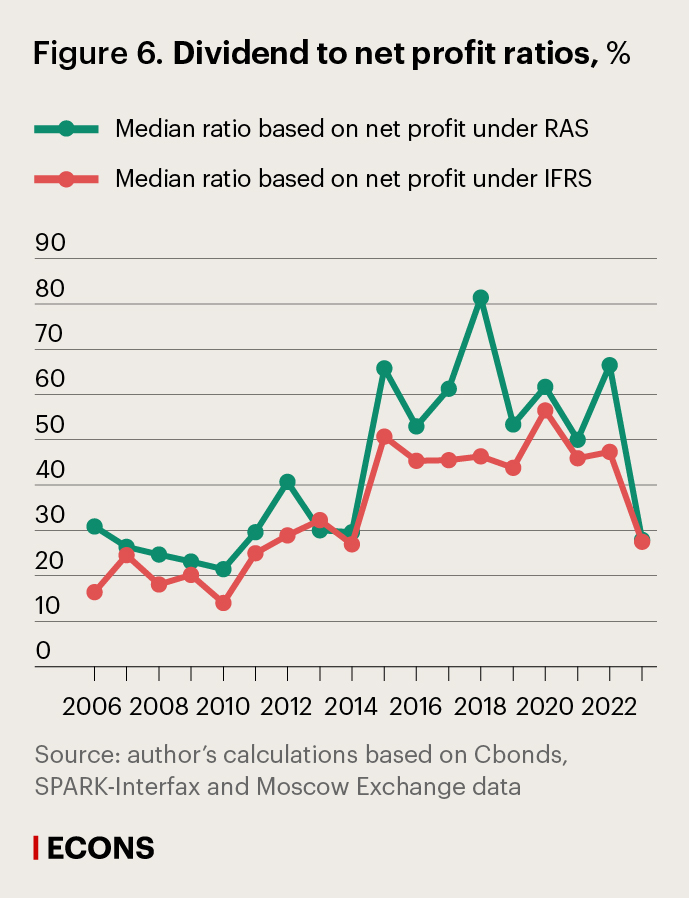
From a methodological standpoint, it is more difficult to measure the shares of net profits that companies earmark for dividends. The basis to calculate the dividend payment ratio may be both the consolidated profits of the group, in line with International Financial Accounting Standards (IFRS), or the unconsolidated profits of the main issuing company under Russian Accounting Standards (RAS), depending on the terms of dividend policy. The calculation is further complicated by the fact that not all dividend-paying issuers disclosed their financial statements for 2022, and very few did so for 2023.
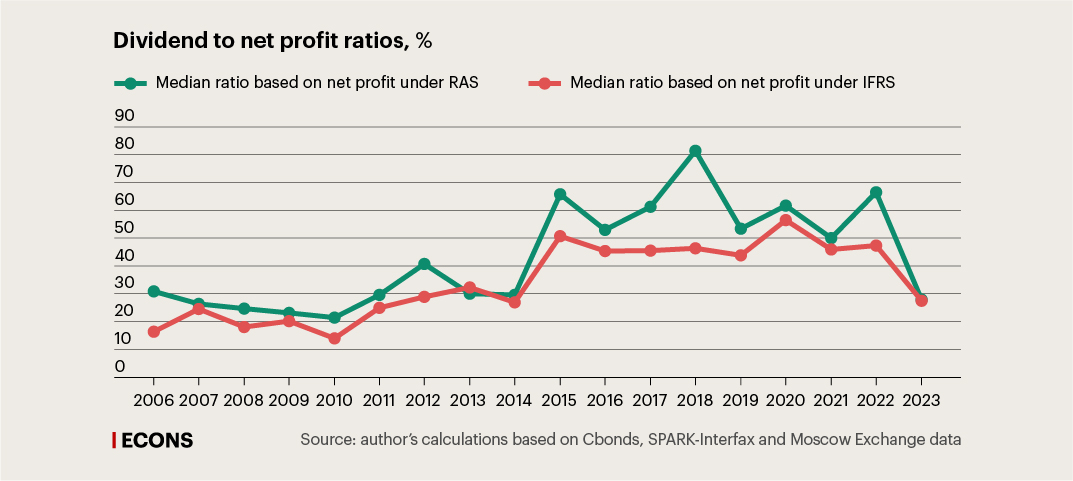
Figure 6 shows the median dividend payout ratios calculated based on RAS and IFRS statements for all shares admitted to the Moscow Exchange for which dividends were paid. The calculations show that the median dividend payout under IFRS was unchanged in 2022 and remained at 2021 level, while that under RAS increased. Historically, the median share of profits distributed has seen little growth if at all, while, when calculated relative to consolidated earnings, the amount of dividends paid was greater than 50% only twice in 17 years (excluding 2023).
At the same time, we see greatly diverging indicators for issuers. Our calculations show that the dividend payout ratios of shares included in the Moscow Exchange Index tend to be higher than those of other exchange-traded shares.
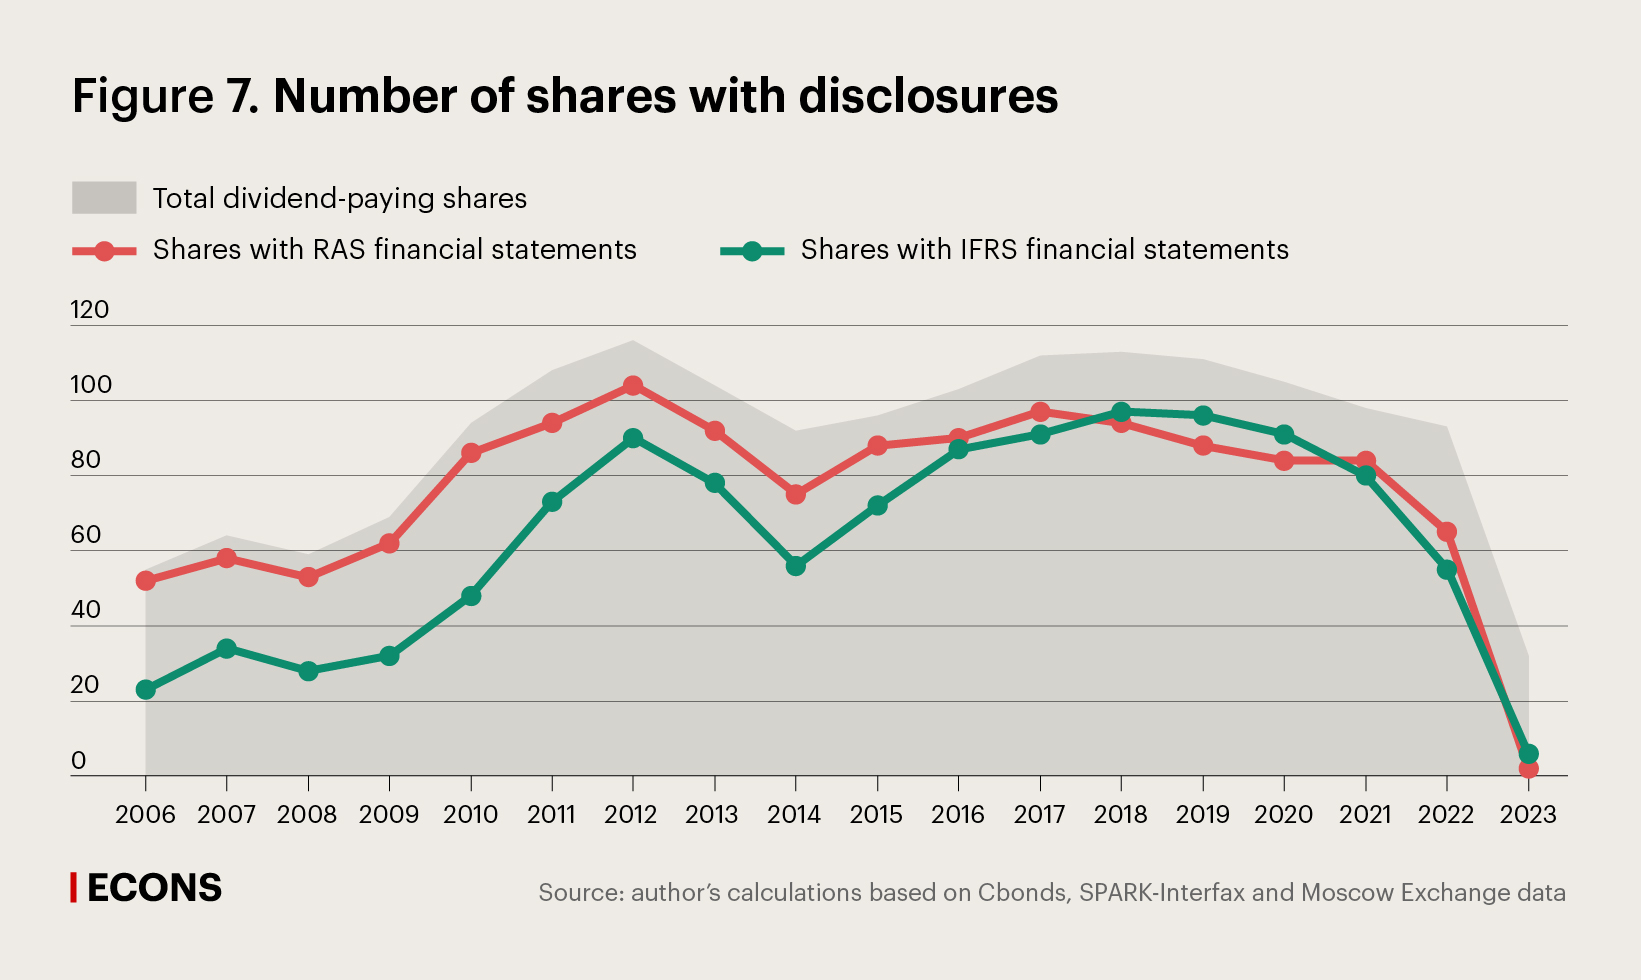
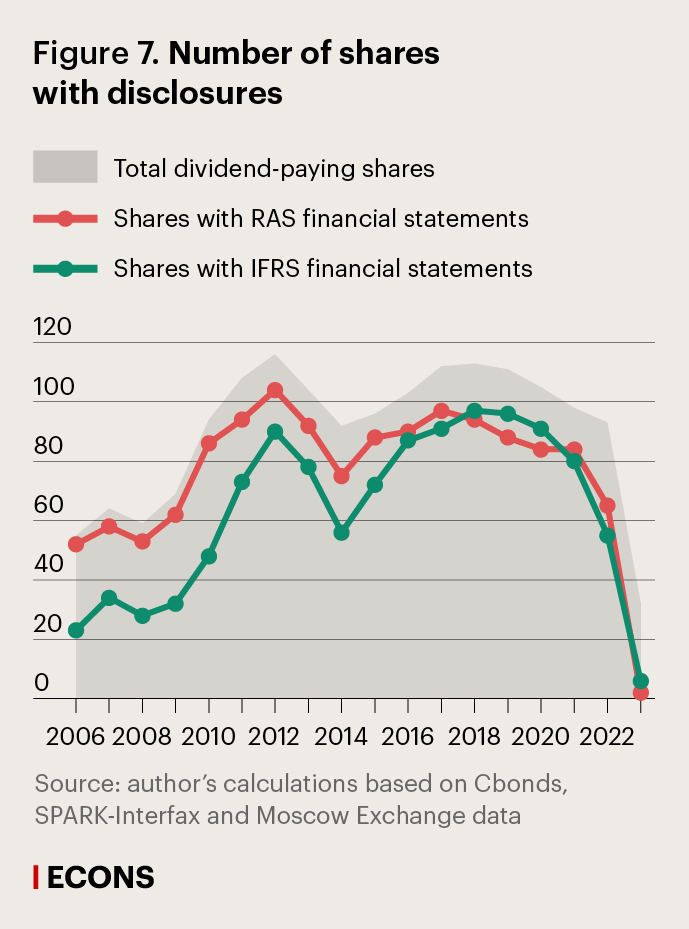
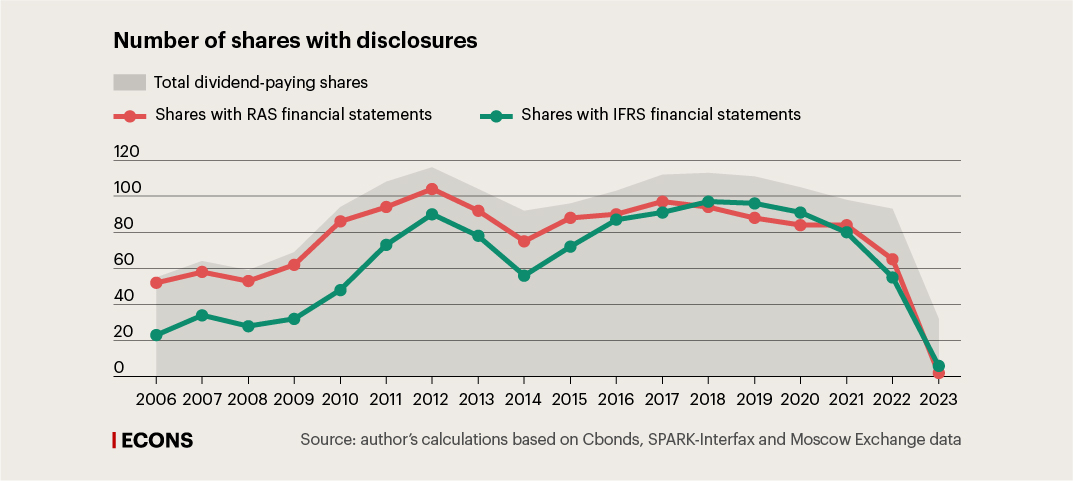
In 2022 and 2023the transparency of the financial statements of dividend-paying issuers drastically declined. Only select companies paid dividends for 2023 (32 payments were made in total). Having said that, as of this writing, only a small number of companies have made their disclosures for 2023. This comes as a result of the relaxations of disclosure requirements enacted by (link in Russian) the Russian Government in March 2022 and subsequently extended (link in Russian). Although the right to financial non-disclosure expired in July 2023, certain relaxations – including the right not to disclose (link in Russian) ownership structures – are still in place.
These measures, intended to boost economic stability in the context of sanctions, have brought about lower information transparency and the ensuing difficulties in calculating the share of profits distributed: once the right to non-disclosure expired, a number of companies resumed the publication of financial results but held off on posting reports for 2022.
Implications of dividends for returns on investment portfolios
The question of how much dividend payments contribute to the growth of the capitalisation of Russian companies and to long-term returns for their shareholders remains open.
Investments in stocks primarily bring two types of returns: from rising share prices and from dividends payments. The two types comprise the total return on investments in stocks.
Based on our calculations, on the one hand, high dividend yield shares have over almost all periods steadily outperformed the portfolio of low dividend yield shares in the amount of total return. For example, over the last five years (2019–2023), investments in high dividend yield shares earned investors a total return of 21.7% per annum, compared with the 19.8% earned on low dividend yield stock.
On the other hand, the performance of high dividend yield shares is mixed when compared with the broad portfolio of the shares of all Russian companies. Between 2022 and 2023, dividend-paying shares generated higher returns over horizons of 10 and 15 years. Over all the other horizons under study – 3, 5, 20 and 25 years (since 1999) – the broad portfolio delivered higher total returns in 2023. For example, over the past five years (2019–2023), investments in the broad share market earned investors an average of 22.2% per annum.
It is also worth noting that, since 2021, the shares of companies with state ownership have generated higher total returns compared with private equity portfolios, while the total return of the latter is much higher over longer horizons of 5 to 25 years. This is also partly due to the liberalised dividend requirements for companies with state ownership.
The several patterns we have identified confirm the validity of Franco Modigliani’s ideas, a researcher who won the Nobel Prize for financial market analysis, that net profits allocated to dividends and dividend yield do not have a crucial effect on company capitalisation and the total returns on shares.
First, despite the growth in dividend payments in 2021–2023, the portfolio of non-paying shares brought higher return than those of high dividend yield shares (27.2% and 19.7% respectively). The same trend was observed over horizons of 20 and 25 years (the total returns on high dividend yield shares were 15.1% and 11.9% respectively, while on shares without dividends, they were 16.6% and 13.1% respectively). At the same time, the total returns on high dividend yield shares were higher over horizons of 5, 10, and 15 years.
Second, in most of the periods under study, shares with higher E/P ratios (net income to market value) were consistently more profitable over a 25-year time horizon (except for in 2009–2013) than high dividend yield stock. For example, over the past five years, shares with high E/P ratios have earned an average return of 26.4% per annum compared to 19.7% on high dividend yield shares. Over the last three years, these numbers are 26.6% and 19.7% respectively, and the return over the last ten years has been 23.3%.
This is evidence that the total returns on shares depend more on the amount of net profits than on their allocation to dividends or other purposes.
Dividend gap
Major dividend payouts usually send the prices of dividend stocks lower in the few days following the ex-dividend date (the date before which investors purchasing shares are entitled to dividends for the past period, and after which this right expires.) The prices of such securities subsequently recover. This is known as the dividend gap.
Our analysis shows that the dividend gap offsets the advantages of the total return of such shares compared to shares that offer no or modest dividends.
Given the error in the databases of the historical sample of dividend payments and the lower liquidity of certain shares, the analysis is based on a time interval of 10 days. The dividend gap is considered the maximum percentage drop in the share price on the calendar day preceding the ex-dividend date. The closing period for the dividend gap is calculated as the number of calendar days required for the share price to rebound to the level of the day preceding the ex-dividend date. It is assumed that if the dividend gap for the share is not closed within 726 or 727 days (common/leap year), it is considered open.
The growth of dividend payments in 2019–2023 came with an increase in the depth of dividend gaps and the timeframes for their closure. For example, the timeframe for closing the dividend gap has averaged about six months since 2019. In 2021, about one third of liquid shares had open gaps for two years, although the gap declined significantly in 2022.
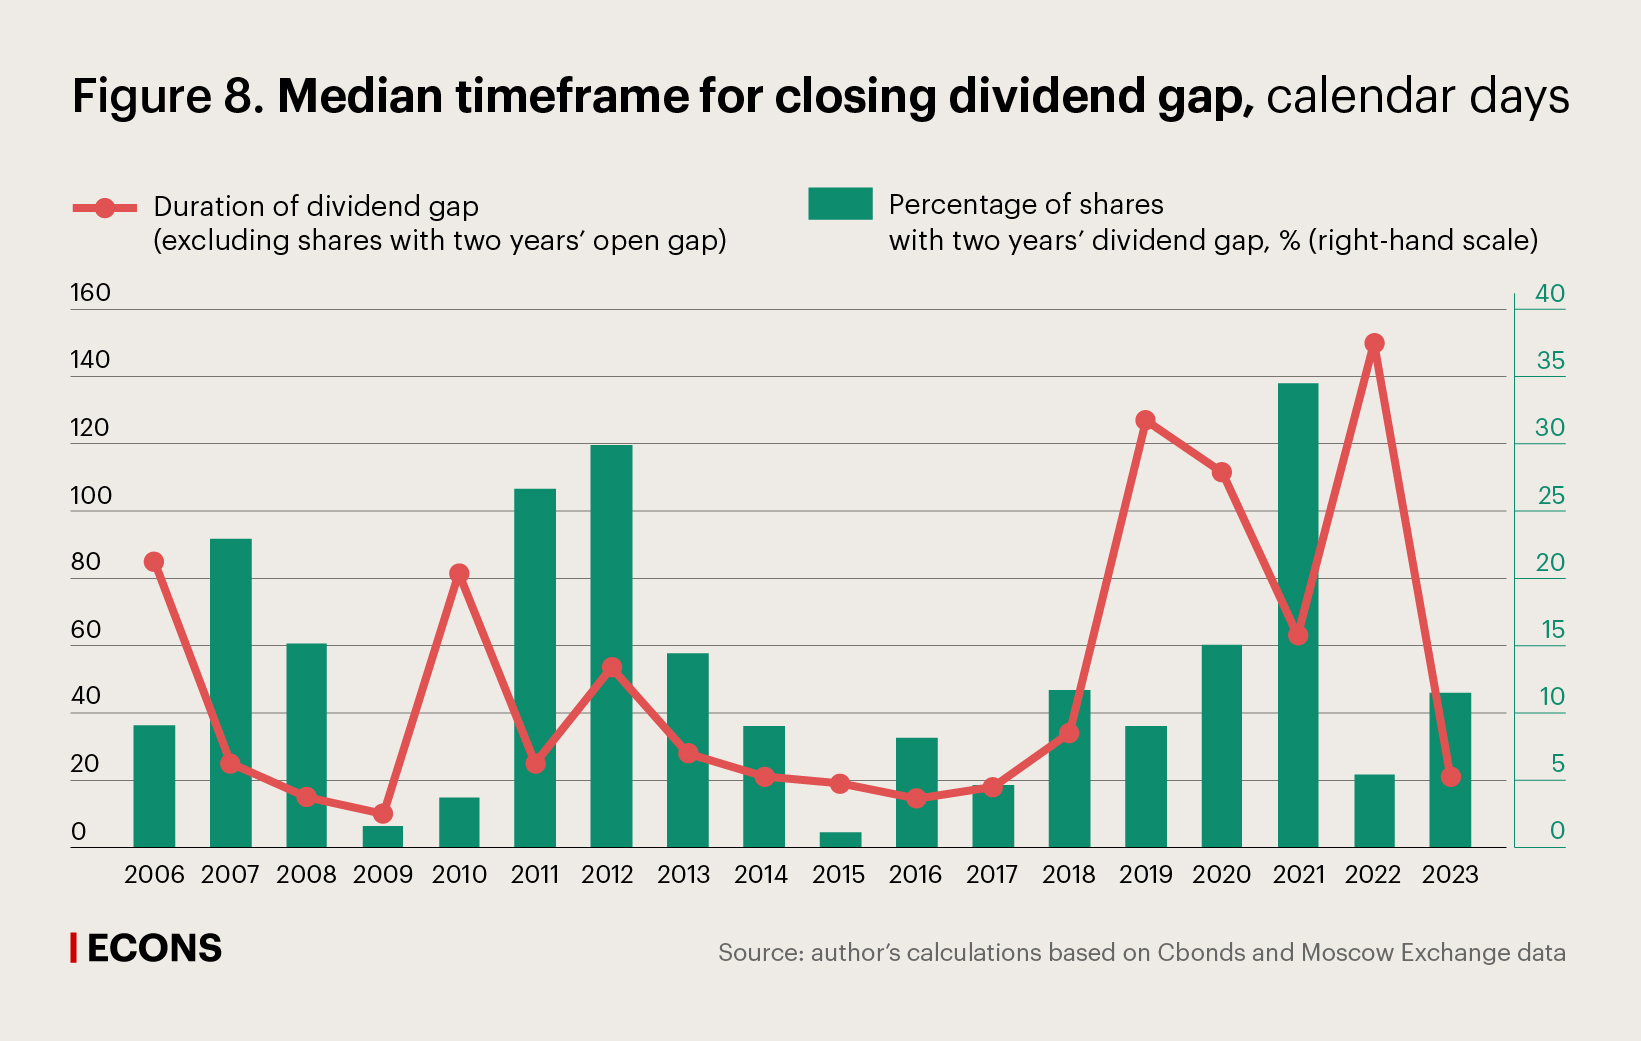
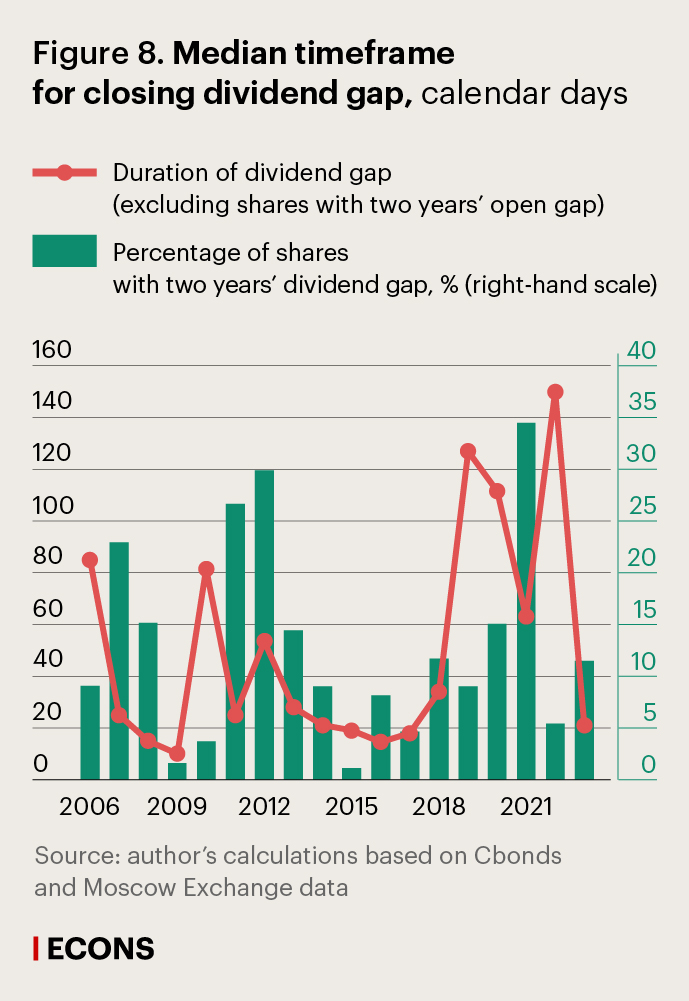
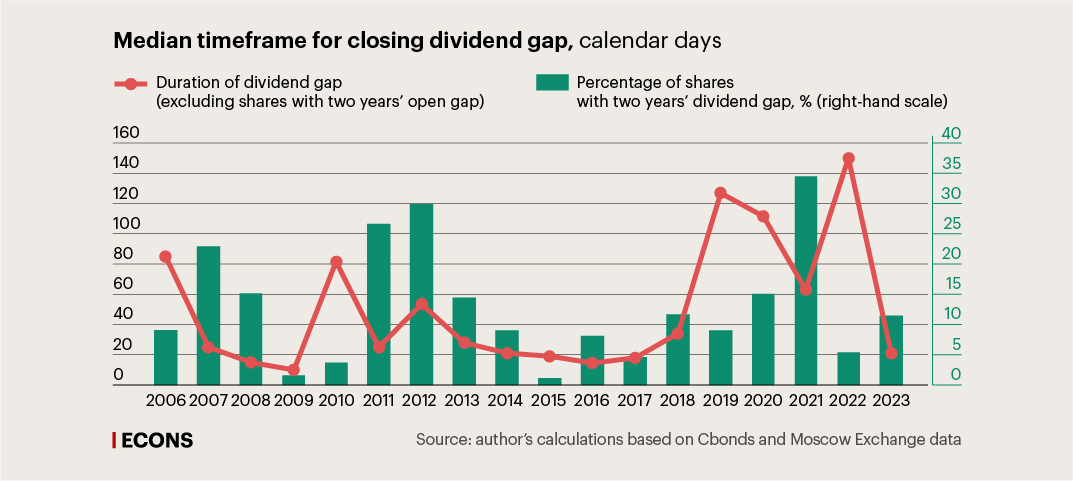
The average dividend gap of a number of issuers is greater than the average dividend yield. The difference between these two measures is up to 5pp in the overall sample.
This means that the selloff of shares by investors expecting to receive dividends after the ex-dividend date is so rapid that total returns may be negative for a large number of investors.
Over 2006–2023, 70 of 1928 events stand out in which the depth of the dividend gap was 25% or higher, with the onset of the ex-dividend date actually triggering a financial crisis, which, according to the classic definition, occurs when the market value of a share declines to a level at which the sale price is lower than the purchase price within a period of up to one year.
Shares sold at prices below the buying price and dividend yield have been typical of the Russian market since it began its operations. This trend has solidified in recent years. Our calculations show that in 2022–2023, the dividend yield of the whole sample was, on average, half the dividend gap, and 2.5 times lower for shares included in the Moscow Exchange Index, primarily for high dividend yield shares.
Risks of dividend strategy
Our research enables us to draw several meaningful conclusions. Over the past ten years, Russian companies have increasingly paid higher dividends, and on a more regular basis. This is primarily true for major corporations and companies with state ownership. At the same time, stocks from Level 3 led in the number of dividend payments, indicating the economy-wide spread of ‘dividend fever’.
The high dividend yield that in recent years has significantly exceeded the yields to maturity on a wide portfolio of government bonds has largely contributed to the emergence of a broad range of private investors in the stock market. This suggests a need for more focus not only on the benefits, but also the risks, of investing in high dividend yield stocks, considering that generous payments bring about the risks of deep and extended dividend gaps, with irrational behaviour by private investors potentially aggravating their consequences.
A high dividend yield does not necessarily mean a higher total return on investments. The analysis of the Russian market confirms that share prices are more affected by net corporate profits than by their allocation to dividends. This is clear from the fact that, over different time horizons, stocks without dividends and shares with high E/P ratios tend to generate higher total returns than high dividend yield shares.
While we do not question the benefits of investors' dividend strategies, we assume that they should be grounded in more complex criteria for selecting the shares in the portfolio, rather than focusing only on measures of dividend yield.
