91-1.webp)
In recent years, Russia’s low economic growth has been attracting particular attention. More and more often, trying to find the reasons for this slowdown, experts resort to structure factor analysis, which means that they increasingly associate the lower growth with potential growth limitations. Bank of Russia officially estimates that the country’s structural growth is between 1.5 and 2%, which is generally in line with IMF and World Bank estimates. The Gaidar Institute’s (in Russian) estimates are also between 1.5 and 1.8%, while OECD has the most conservative views, estimating Russia’s potential growth at 0.5%. Thus, potential growth estimates are between 0.5 and 2%.
Given the wide spread in estimates and the variety of the methods used to analyze structural growth, we have decided to rethink the existing approaches and offer our estimates of potential output dynamics. Since the majority of the approaches are based on analyzing the key components of the production function, namely fixed asset investment, labor market, and productivity dynamics, we, following this approach, will evaluate all these elements one by one.
Investment: slow growth and weak structure
The structural weakness of investment and its low growth are negative factors for economic growth. In 2000-2017, the investment-to-GDP ratio in OECD countries was 24%, on average, while in Russia it amounted to 22%. Investment plays quite a moderate role in GDP growth, which is demonstrated, in particular, by the fact that GDP growth by 8.5% in 2008-2017 was accompanied by the investment decline by 0.3%.
In recent years, the composition of investment has changed with the construction investment gaining a bigger share and reaching 44% of the total investment, compared to 42% in 2013. Meanwhile, the share of the machinery and equipment investment has decreased to 34%, compared to 39% five years ago. For comparison: Poland and the Czech Republic, that are comparable to Russia in terms of GDP per capita (PPP), increased the shares of the equipment investment in their total investment from 44% in 2013 to 48% in 2017 and from 58% to 60%, respectively.
In Russia, the intellectual property investment accounts for a mere 3% of the total investment, the lowest among OECD countries. In some developed countries, including the UK and the USA, the intangible asset investment is even bigger than the equipment investment.
Constraints in the labor market
Despite the positive dynamics, the labor market also acts as a constraint on economic growth due to the worsening of the demographic situation. The share of the working-age population declined from 72% of the total population or 103 million people in 2010 to 68% or 98 million in 2017 (excluding Crimea). The share of the population above 65 years of age increased from 13% or 18.2 million people to 14.2% or 20.9 million over the same period.
The limited labor supply is compounded by the distinctive features of the Russian labor market itself. Firstly, the rate of informal employment in Russia is high, and, for the last five years, it has been up to 20% of the total employment, according to Rosstat. Another distinctive feature of the Russian labor market is the big share of the workforce employed in the public sector. IMF estimated it at 31% of the total employed population and considered this value to be rather high, according to international standards. Given the structure of the Russian economy, we can expect that the current share of the workforce employed in the public sector will remain quite stable in the short term.
Besides quantitative constraints registered in the labor market, the issue of workforce quality is becoming more urgent. Despite Russia’s lead in the number of engineering graduates and its being the country with a highly educated population, the professional capacities of employees do not always correspond with the company’s requirements: the Executive Opinion Survey by the World Economic Forum found that lack of practical skills takes the sixth place among the issues that Russian companies face. In Canada, where the share of the population with higher education is the same, employers are almost twice more satisfied with the professional capacities of employees.
Quantitative and qualitative factors create a supply deficit in the labor market, which a greater workforce engagement in professional activities compensates only partly. This situation leads to unstable economic growth and creates barriers to productivity growth.
Total factor productivity issues
Productivity is the third factor that determines economic growth. It reflects the overall efficiency of the production process and is associated with such factors as institutional innovation, knowledge, technology adaptation.
In the early 2000s, Russia’s productivity was growing extremely fast, narrowing the gap with the USA by 17 percentage points in 10 years: from 20% of the USA productivity in 1997 to 37% in 2007. During the next 10 years, this gap was narrowed only by 6 percentage points, reaching 43% in 2017, because Russia’s productivity growth stabilized at 1-1.5%.
Weak productivity growth is directly related to the economy’s ability to use new technologies. In Russia, only 8% of the companies (as per 2016 data) are involved in innovations. This rate is very low; for example, such companies amount to 41% of the total in China, 51% in Turkey, 64% in India. In 2000-2016, information technologies contribution to GDP growth reached a mere 5%, compared to average 8-13% in emerging markets.
Calculation using the production function
Given all the above-mentioned factors, we have calculated potential output using the production function as per the method described by Jaromir Benes of IMF and his co-authors in their paper. This method is based on the estimation of the output gap (the difference between the actual and the potential output), as well as the differences between the actual employment and capacity utilization and their natural (equilibrium) values.
The analysis of potential output growth factors shows that capital provides the biggest contribution to equilibrium growth (around 0.5 percentage points in 2017), labor gave about 0.2 percentage points more, but, to a greater extent, the stagnation of potential growth can be attributed to Total factor productivity — the third factor, which is completely used up. (SEE THE CHART) Thus, at the end of 2018, the potential economic growth rate is estimated at 0.7%, while the output gap is around -0.1%.
Factors’ contribution to the potential growth (%)
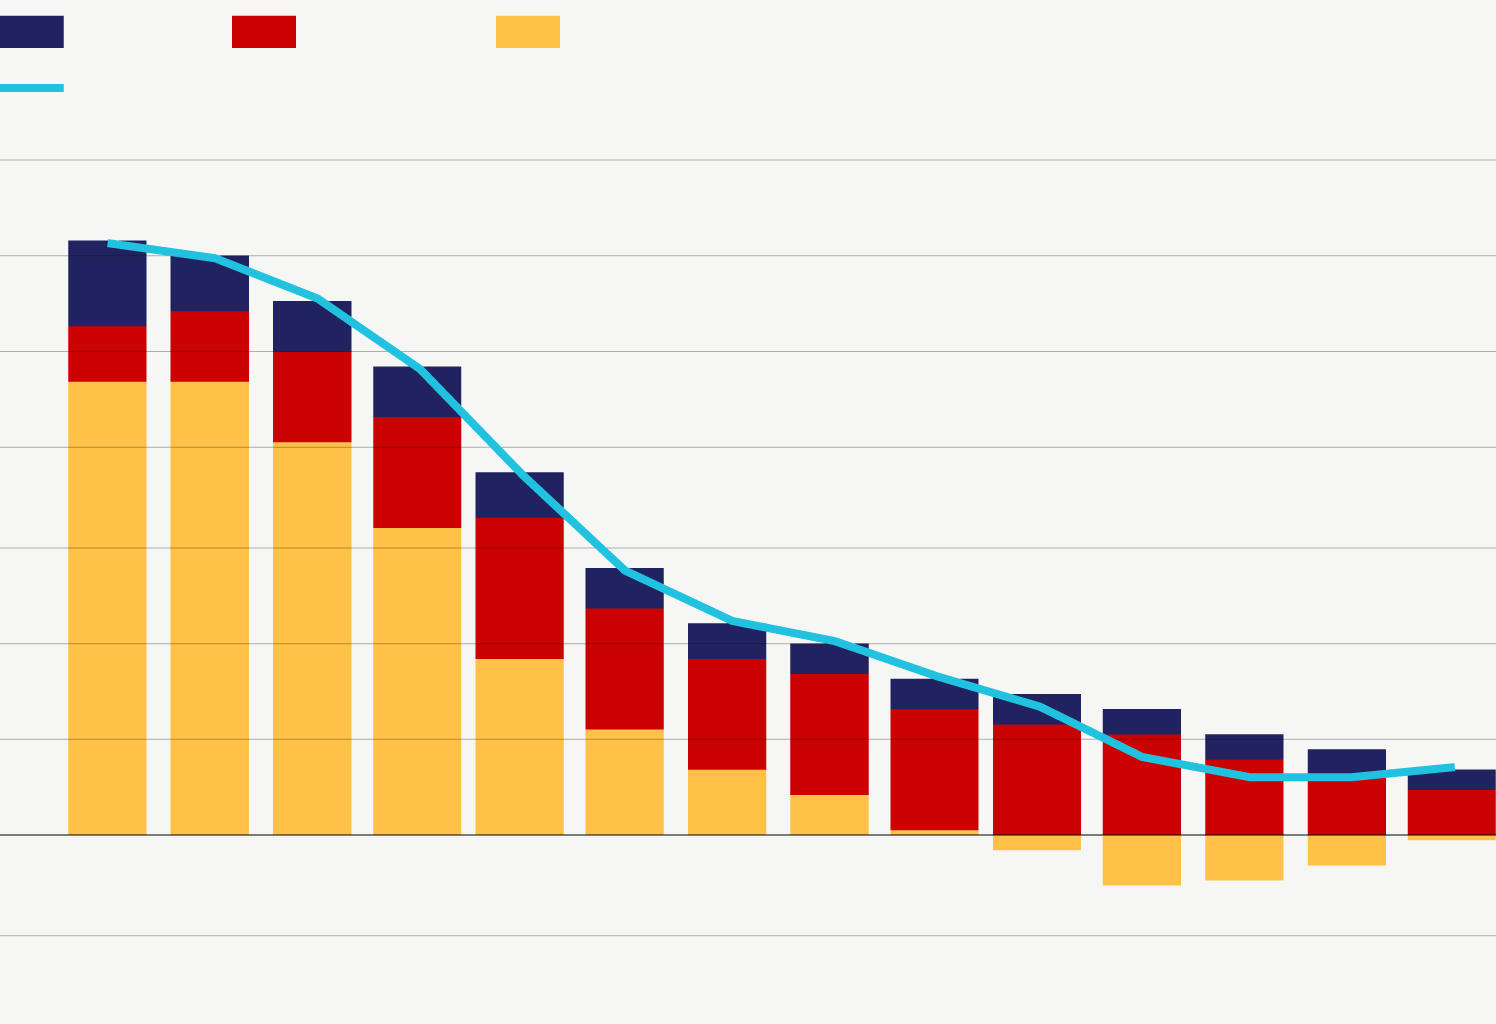
Labor
Capital
Total factor productivity
Potential growth rate
7
6
5
4
3
2
1
0
-1
2004
2005
2006
2007
2008
2009
2010
2011
2012
2013
2014
2015
2016
2017
Source: Rosstat, Alfa-bank
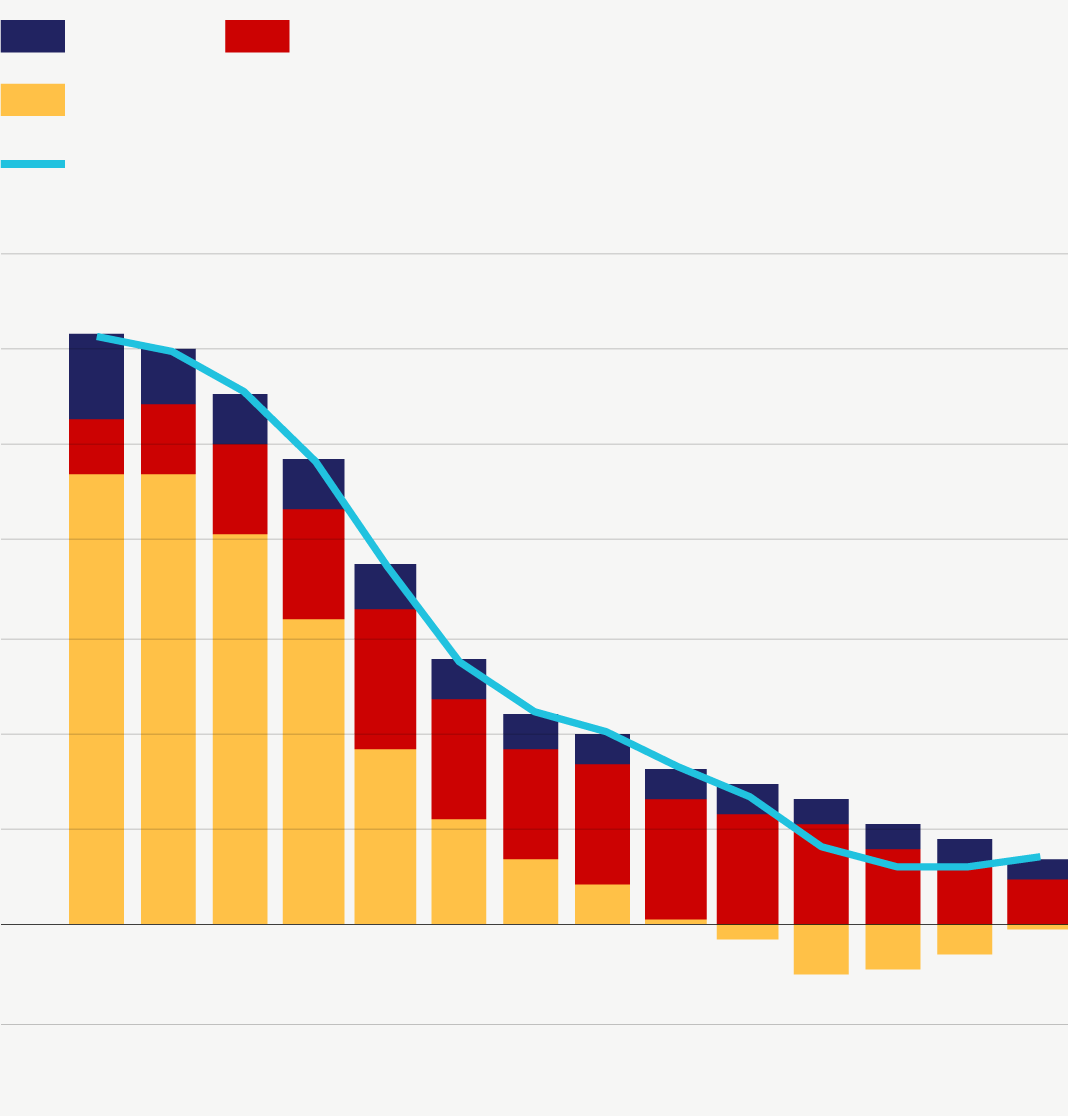
Labor
Capital
Total factor productivity
Potential growth rate
7
6
5
4
3
2
1
0
-1
2004
2005
2006
2007
2008
2009
2010
2011
2012
2013
2014
2015
2016
2017
Source: Rosstat, Alfa-bank
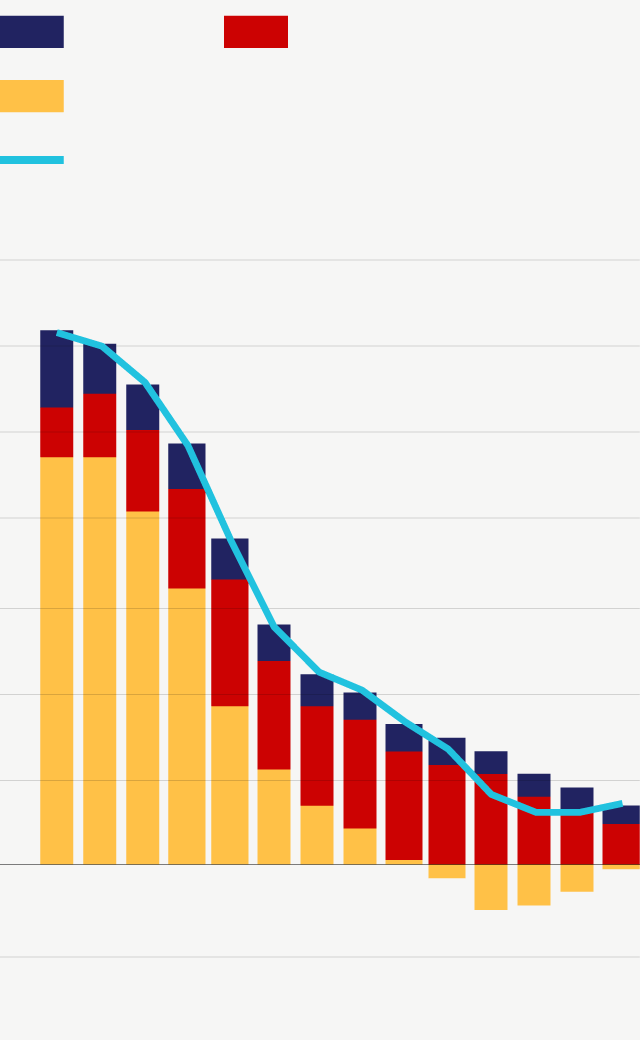
Labor
Capital
Total factor productivity
Potential growth rate
7
6
5
4
3
2
1
0
-1
2005
2010
2015
Source: Rosstat, Alfa-bank

Alternative estimates of the potential growth
Having calculated the potential output growth rate at a mere 0.7% (lower than the consensus estimate of 1.5-2%) we have decided to use alternative approaches as well.
We have estimated the potential output through the equilibrium interest rate. This method was described by Thomas Laubach and John Williams of FRS in their papers, and, to a greater extent, it is based on monetary indicators. The output gap is estimated using a parallel calculation of the difference between the actual interest rate and its equilibrium value at which output is equal to potential GDP and the inflation rate is targeted and stable. This model estimates the potential growth at 1.1-1.3%, which is higher than the production function estimate. Maybe, the reason is that this method does not account for demographic restraints.
That is why we have separately evaluated the effect of labor, using the model based on Okun’s law. At its core is the inverse relationship between GDP growth and unemployment rate. As a rule, the correlation coefficient of the unemployment rate versus output growth (Okun’s coefficient) equals to 0.33. It means that if GDP falls by 3%, unemployment rises by 1%. However, in the Russian economy, where the labor market is rigid, Okun’s law might be weaker; for example, IMF estimates this coefficient at around 0.11. Assuming that Okun’s coefficient is within the range of 0.11-0.33, we have calculated the potential output growth that falls within the range of 0.95-1.2%. However, the estimate based solely on labor market state and GDP growth is an approximation and is more of a benchmark.
All in all, our estimates of the potential output growth fall within the range of 0.7-1.3%, which means that different methods provide a rather stable result that reflects Russia’s economic growth dynamics for the last 17 years.
Potential output losses due to sanctions
We realize that our estimates seem quite conservative, but we deem it warranted, given the negative influence that external factors have on the Russian economy. We mean the sanctions that within our approach are considered the new environment for the Russian economy, i.e. they are structural and not cyclical (temporary) constraints which, in particular, manifest themselves in the limited access to financial markets and innovative technologies.
We used SVAR (structural vector autoregression) to evaluate potential output losses due to the sanctions. Its a priori condition is that the shock of the sanctions is directly reflected in the lower debt load of the corporate sector. We have separated sanctions effect from other shocks and calculated it to be, on average, 0.3 percentage points of potential output growth per annum, while total potential growth losses due to the sanctions reached about 1.2% by the second half of 2018. Thus, our conservative approach to potential growth estimates is justified by the significant negative effect the sanctions had on the structural growth.


