Since 2017, all cash registers (link in Russian) in Russia have been transmitting (link in Russian) electronic copies of receipts online directly to the database of the Federal Tax Service of Russia. All retailers are required (link in Russian) to have cash register equipment (CRE). Thus, the database of electronic receipts offers a vast array of data on retail sales, which can be used for various analytical purposes.
Using these data, we can monitor and analyse price changes on a daily basis, without having to wait for the release of the official data, which are published with a significant time lag. For example, Rosstat’s monthly price indices are published with a delay of 10–15 days, while weekly price indices are published with a two-day lag. CRE data will make it possible to monitor price shocks and their propagation, the exchange rate pass-through to prices, the degree of price rigidity, consumption dynamics, and much more. In addition, these data may help in the study of prices for goods not covered by the Rosstat methodology, which significantly enhances the capacity to analyse inflationary processes.
For our study, the Federal Tax Service of Russia provided anonymised data from receipts for the period from 1 January to 30 September 2022. This dataset contains 53 billion receipts with 150 billion records, and the number of unique product names exceeds 3 billion.
The data are anonymised, making it impossible to identify retail outlets or sellers’ addresses. However, we do have information about the date of purchase, its region, city, or district, as well as the data necessary for compiling a price index: the product name, the quantity sold, and the price. We can also see, for example, that two receipts were issued by the same cash register (although the data about the owner of the cash register are not available to us).
We presented our methodology at a workshop (link in Russian) organised by the Bank of Russia, the New Economic School, and the Bank of Russia’s Joint Department at the Higher School of Economics, a review of which was published in the latest issue of the Russian Journal of Money and Finance.
Features of the methodology
Calculating a consumer price index (CPI) based on CRE data requires a methodology that is different from conventional approaches employed by statistical services, as it must take into account certain aspects of such data.
Specifically, to compile a traditional CPI, we need to identify each product and its characteristics accurately, e.g., ‘sterilised whole milk with 2.5–3.2% fat’ with an indication of its brand and manufacturer. In the receipt data, the only field that identifies the products is the name, which is not always filled in strictly and uniformly, making it difficult to identify them accurately.
We have developed a special structure of product categories (see the box) that takes into account these features of CRE data. Semantically, it is close to the structure of Rosstat’s CPI, although significantly modified: for instance, we classify all types of milk into one category – ‘Milk’ – irrespective of fat content or other characteristics.
Furthermore, there are often gaps in CRE data as certain goods are not available on a regular basis, may disappear from stores and then come up for sale again. In such cases, statistical services use similar items to keep the data series continuous. However, when it comes to the data contained in receipts, this approach is difficult to implement due to the large number of receipts and the insufficient information on the characteristics of products. In our methodology, such ‘disappearing’ goods are simply included in the calculation of the index with zero weight.
These features of CRE data also causes other differences between traditional indices and indicators calculated based on CRE data. The former account only for ‘shelf prices’, i.e., asking prices, in most cases excluding discounts, bonuses, and promotions, while our methodology uses ‘transaction prices’ – the actual prices at which products were bought. Moreover, weights in a traditional index are based on the data from surveys on household spending and are revised annually, whereas the use of CRE data provides insight into the current structure of consumer spending, thus making the index more relevant.
Before calculating the index, we clean the data thoroughly by removing receipts with abnormally low or high totals from the sample, as well as those receipts on which the sum of the individual items does not match the total amount of the receipt. Refunds are also excluded.
We use the Time Product Dummy (TPD) econometric model to calculate the price index. Unlike many traditional indices, TPD does not depend on the base period and does not require dealing with ‘disappearing’ goods: if a product is registered in at least two periods, it will have a bearing on the index. The TPD model assumes that the price of a particular product reflects the overall time trend adjusted for the quality of that product and a random effect. In other words, the price is made up of a trend component, a stable qualitative characteristic, and a random effect.
At the current stage, we are working with more than 300 categories of goods and services, most of which are food products and non-food goods. Services are still rather narrowly represented (about ten categories) due to the challenges related to their classification. Nevertheless, we already include some services, such as transportation and communication services, in our analysis. At the moment, we continue to expand the classifier and improve the classification algorithm to analyse a wider range of goods and services.
Comparison of indices
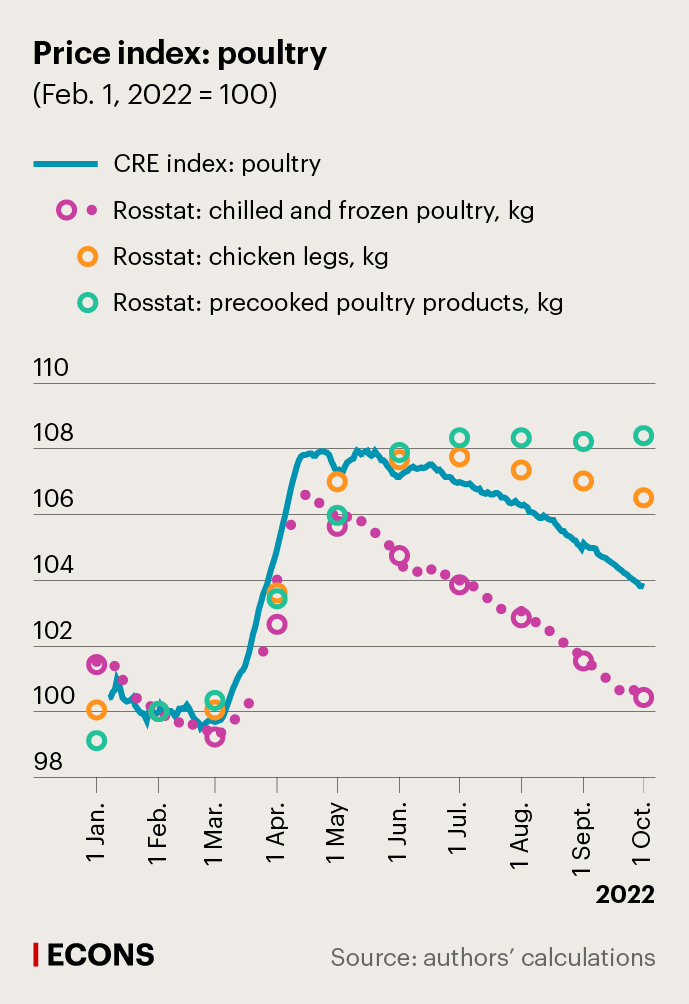
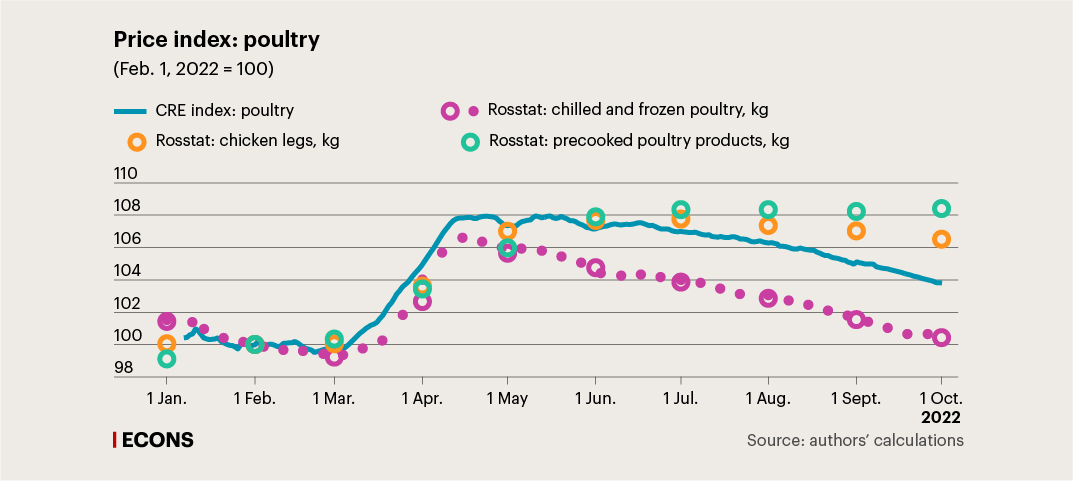
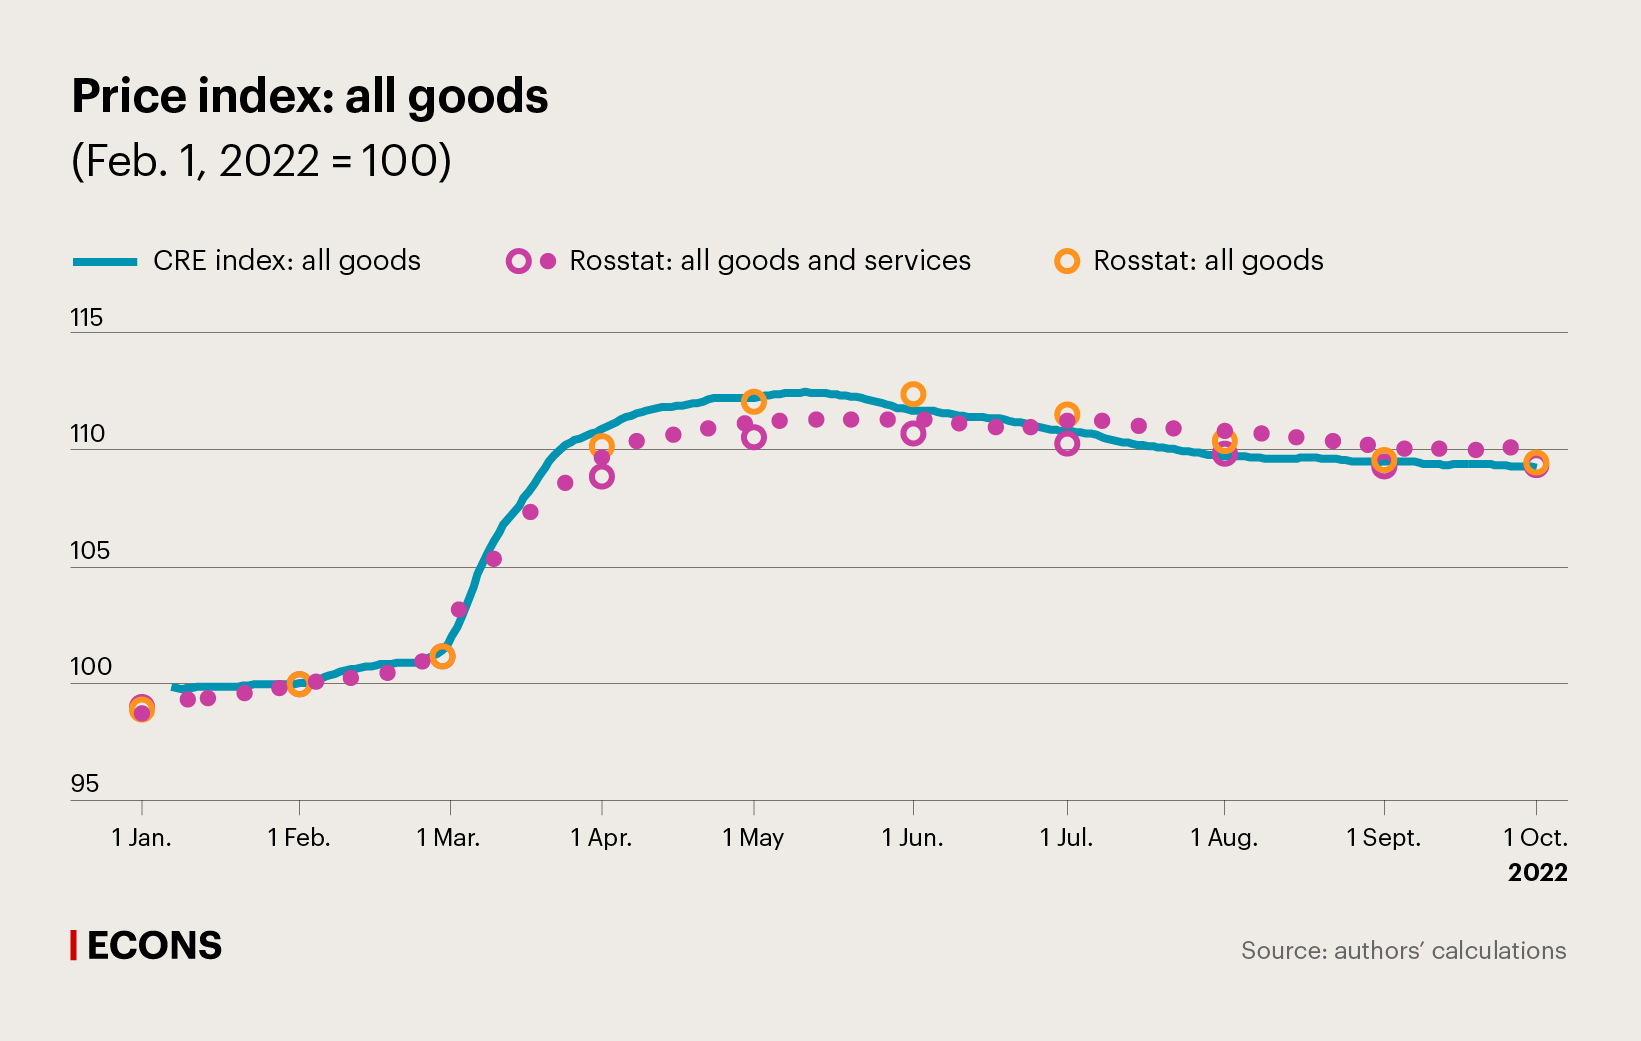
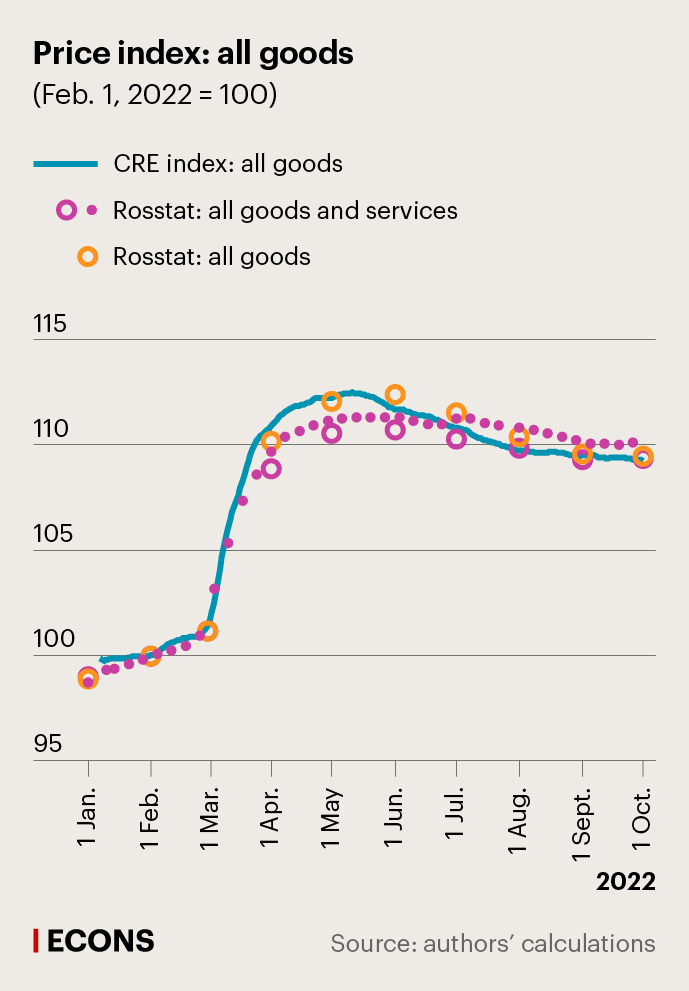
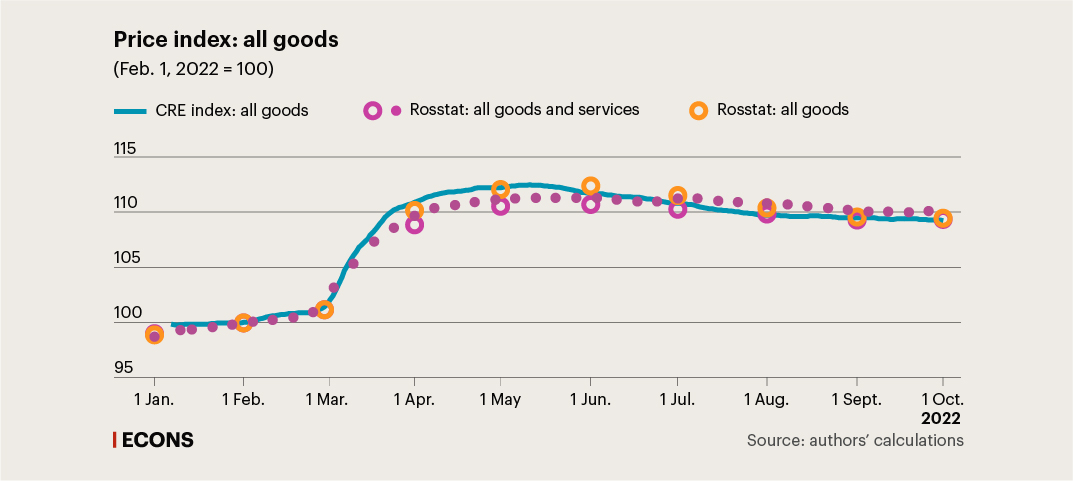
A comparison of the TPD index compiled using CRE data with Rosstat’s weekly and monthly indices shows considerable similarities, especially for food products. It is noteworthy that in certain cases, the calculated index serves as an aggregator of various Rosstat indices, e.g., for the ‘Milk’ and ‘Poultry’ categories (see the charts below; all charts show price indices for Russia as a whole). This is explained by the structure of the product categories used for CRE data. Likewise, a significant similarity between official price indices and TPD indices based on CRE data is observed for non-food goods, in particular for electronics.
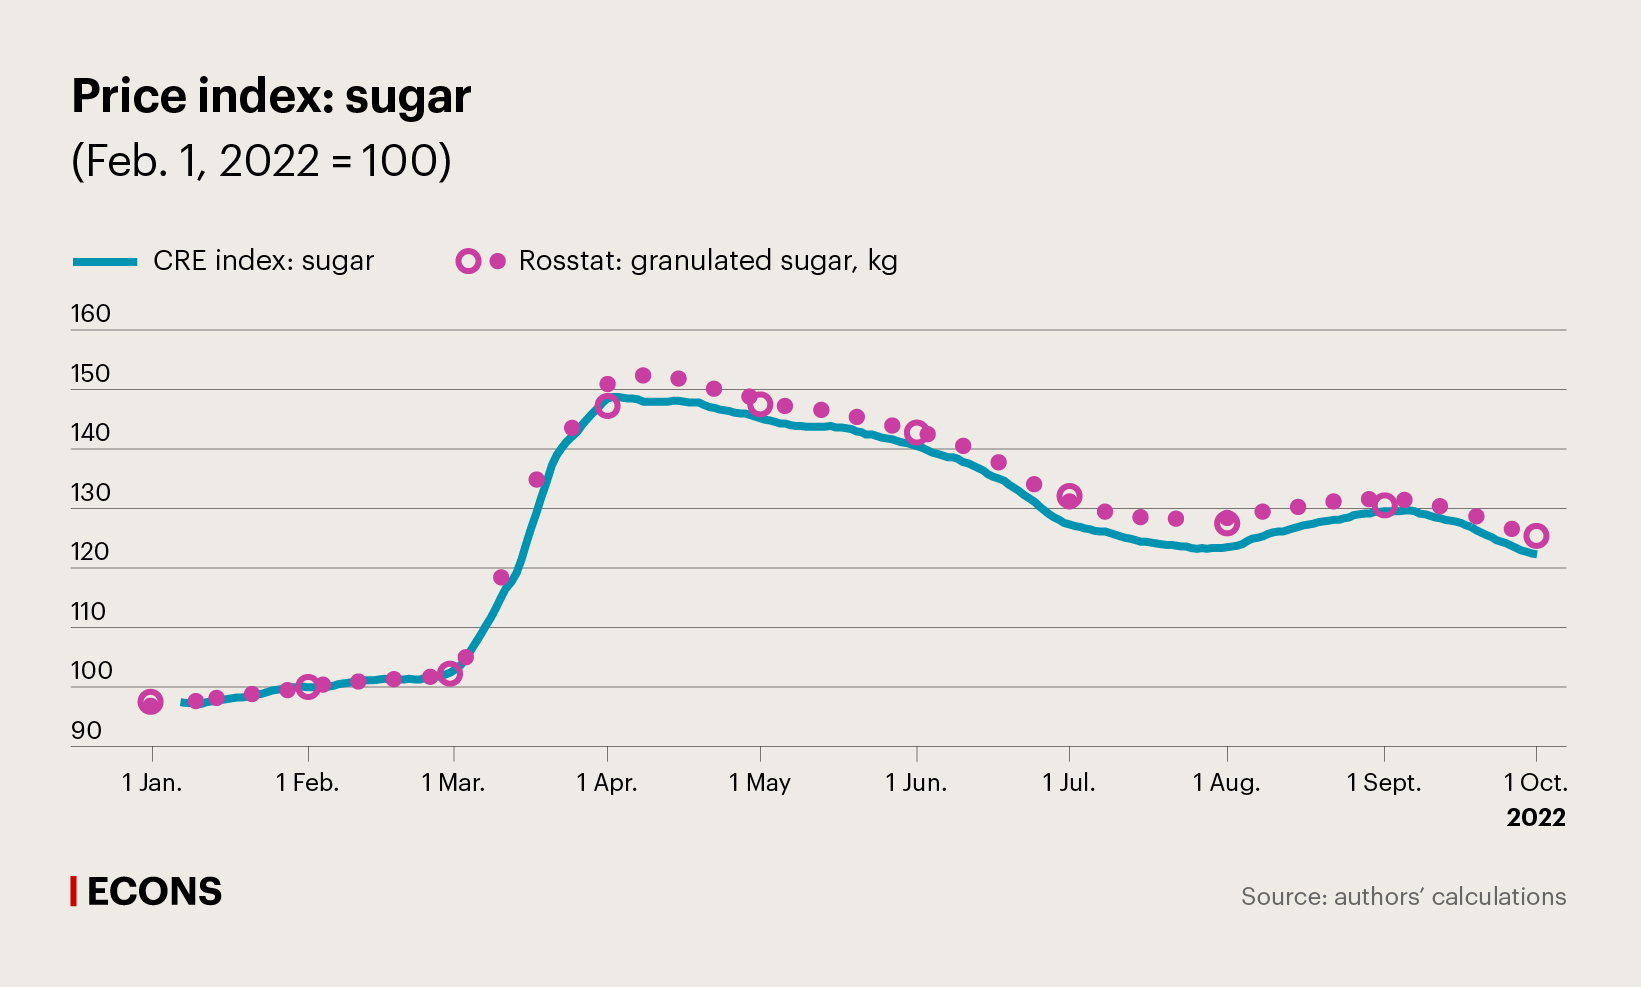
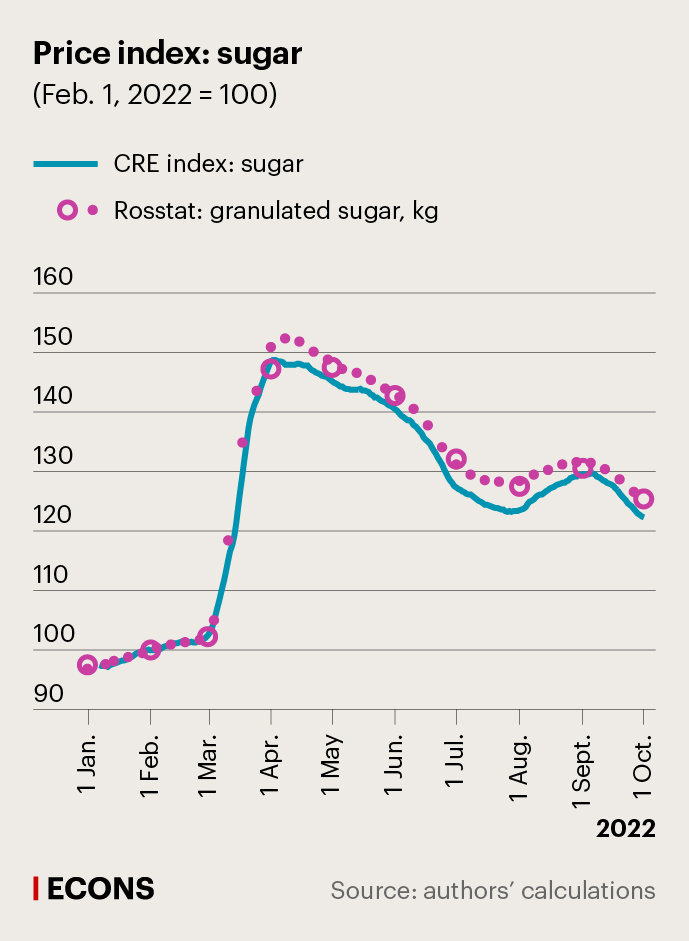
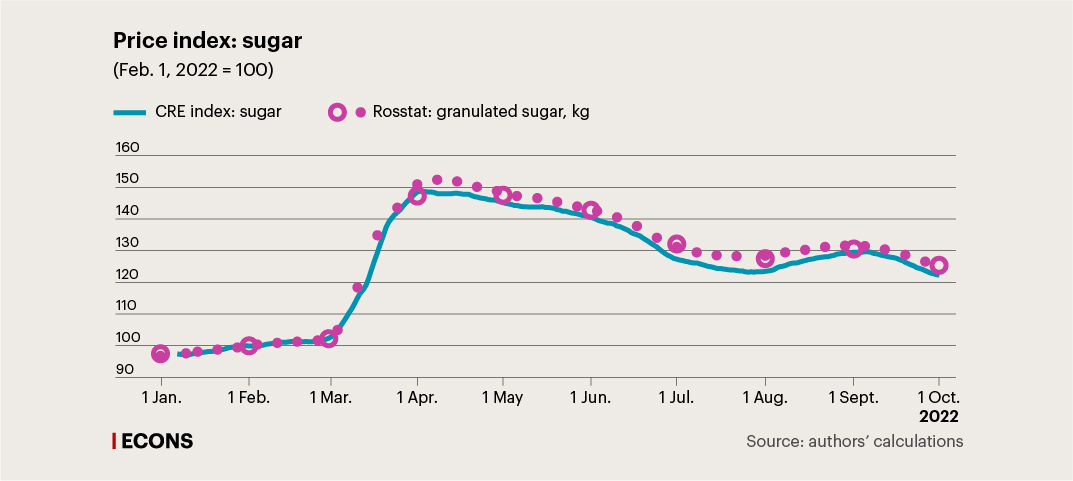
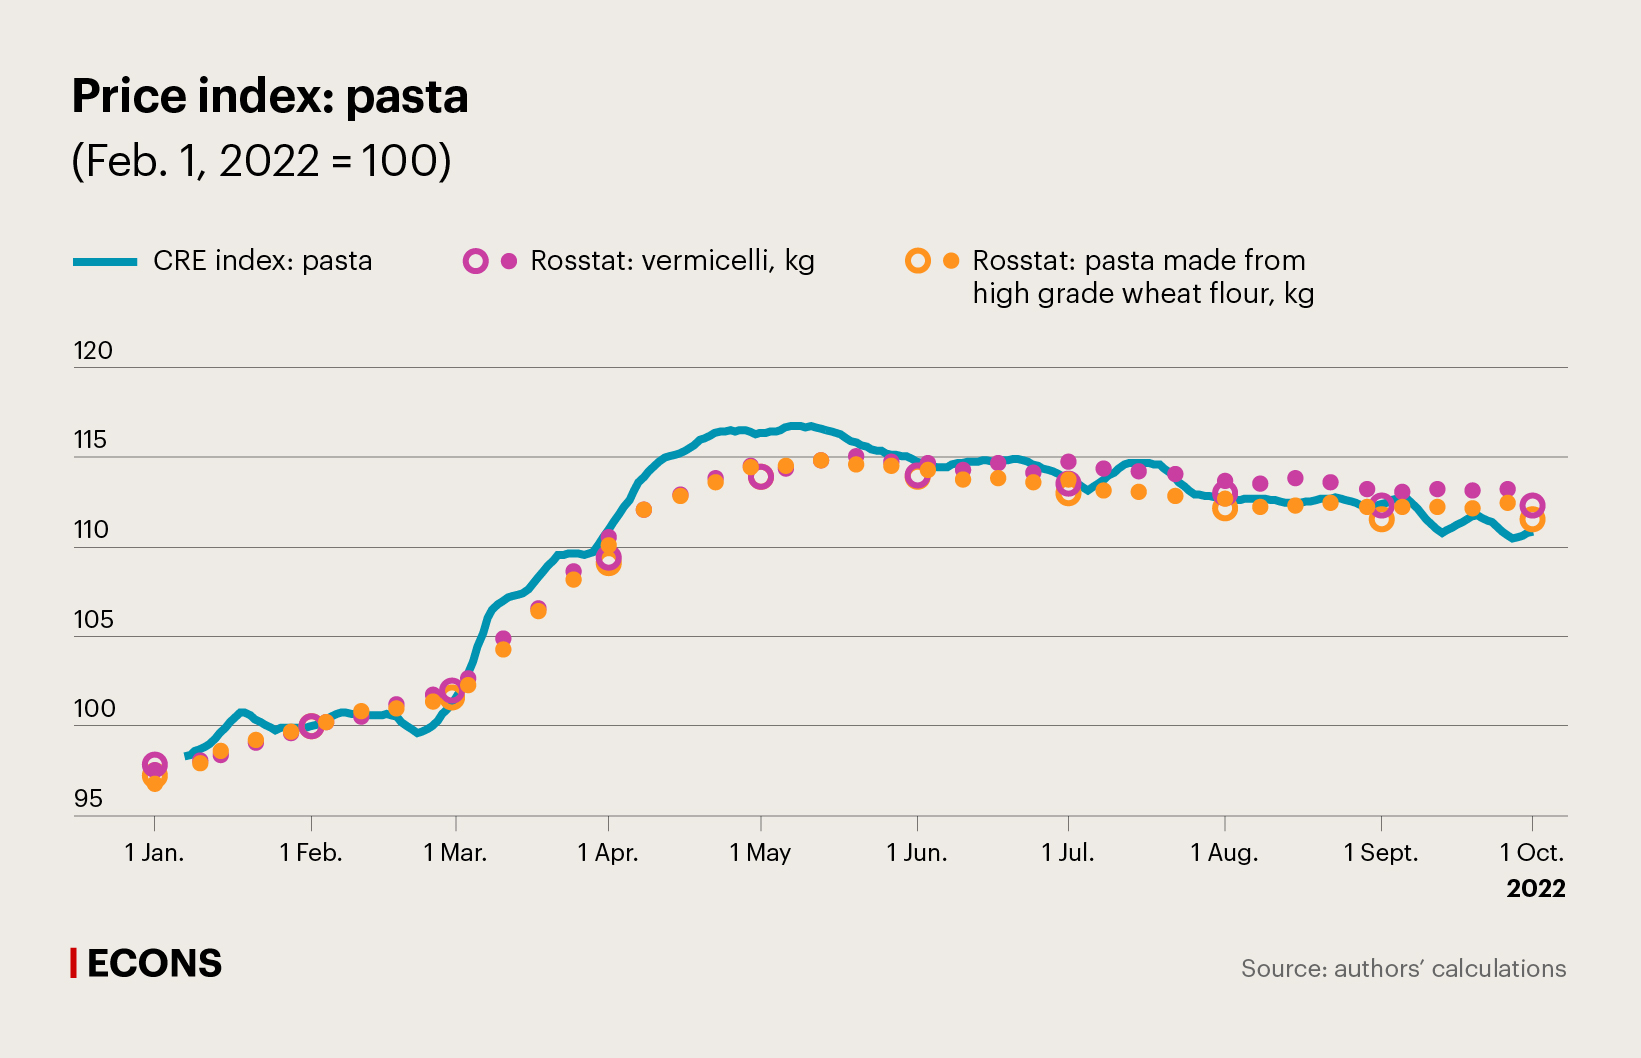
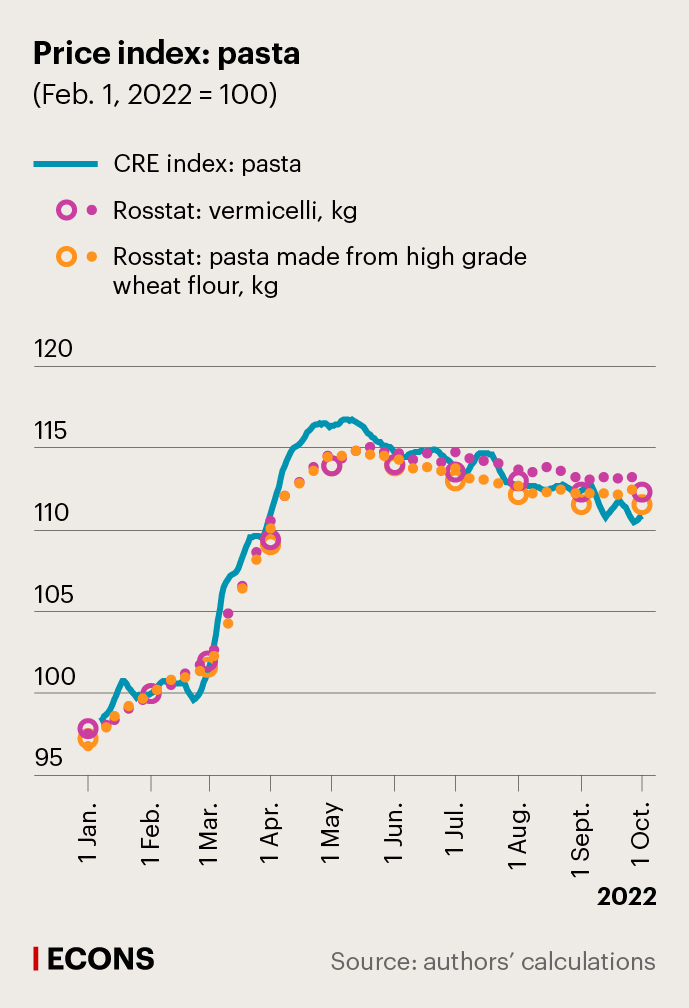
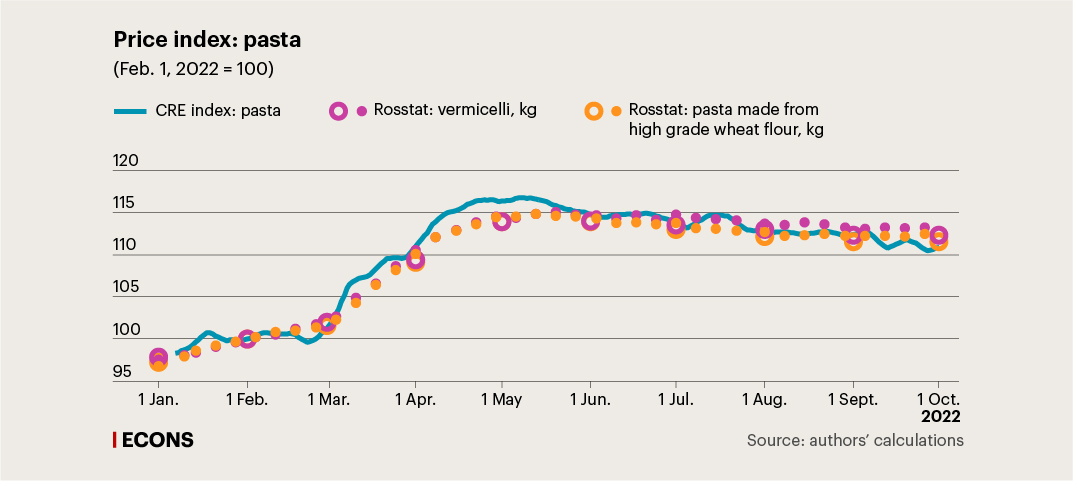
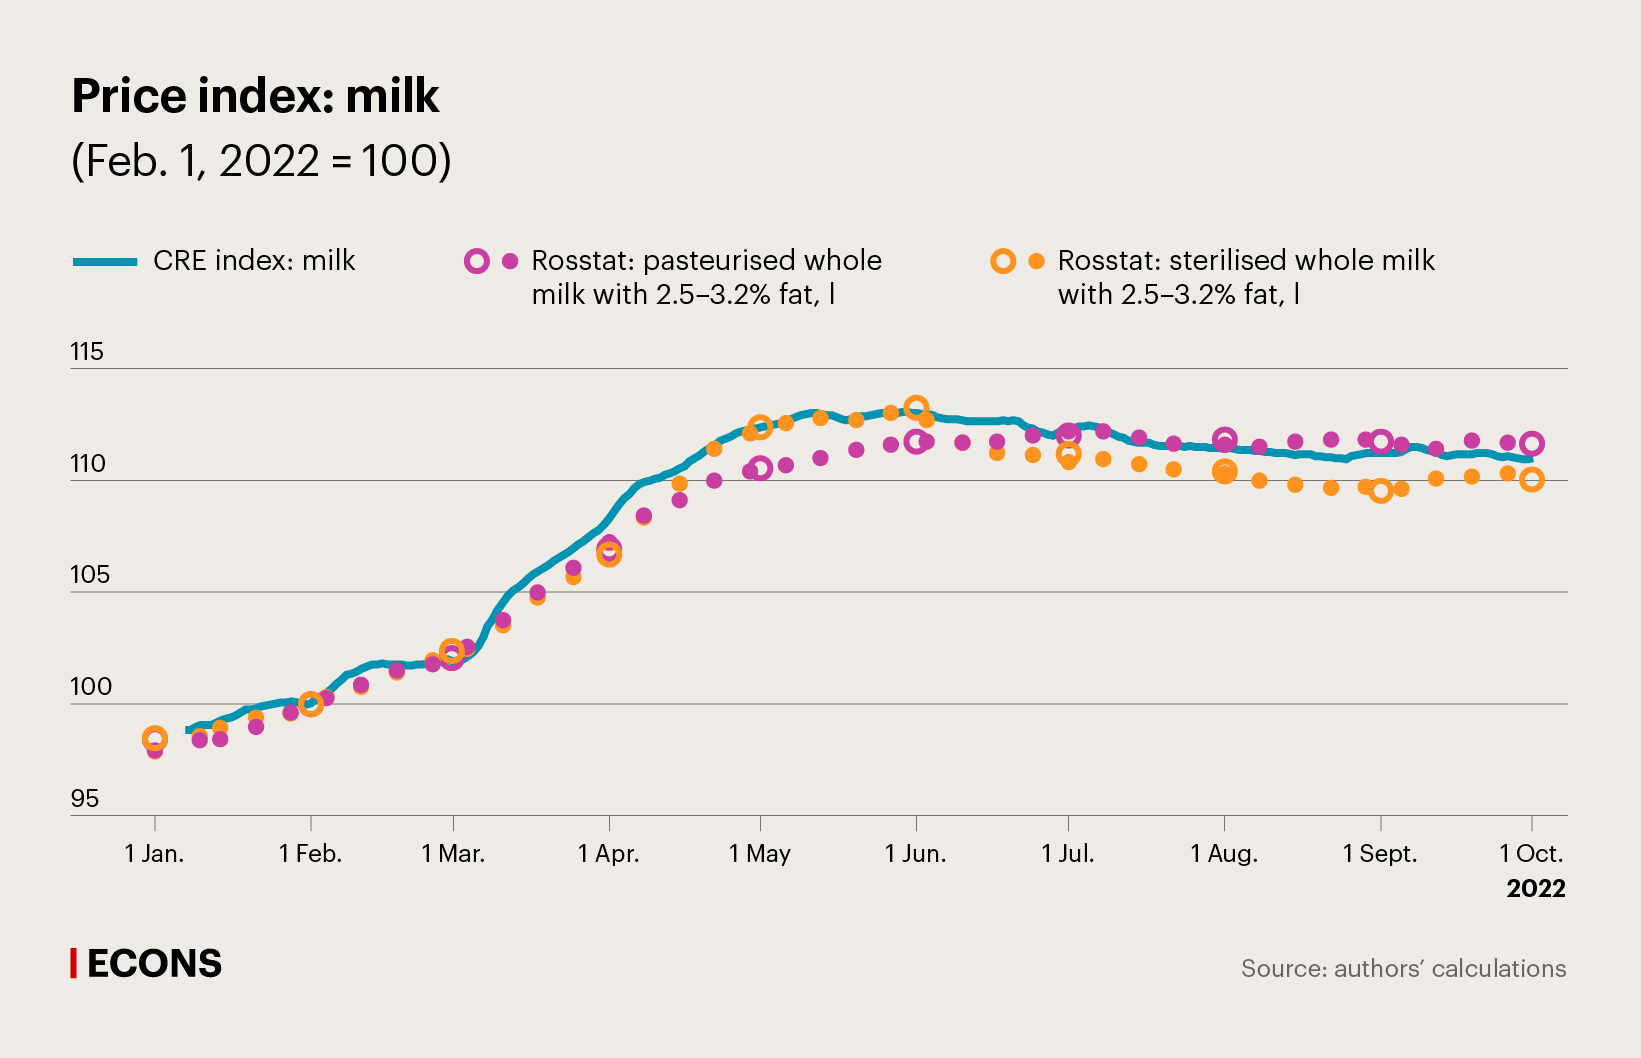
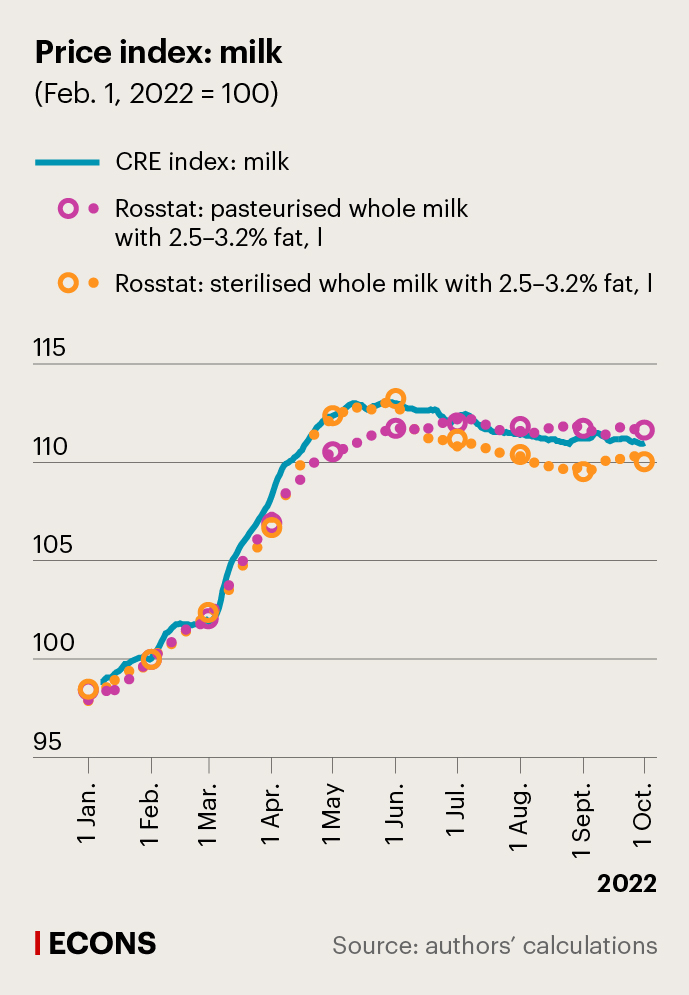
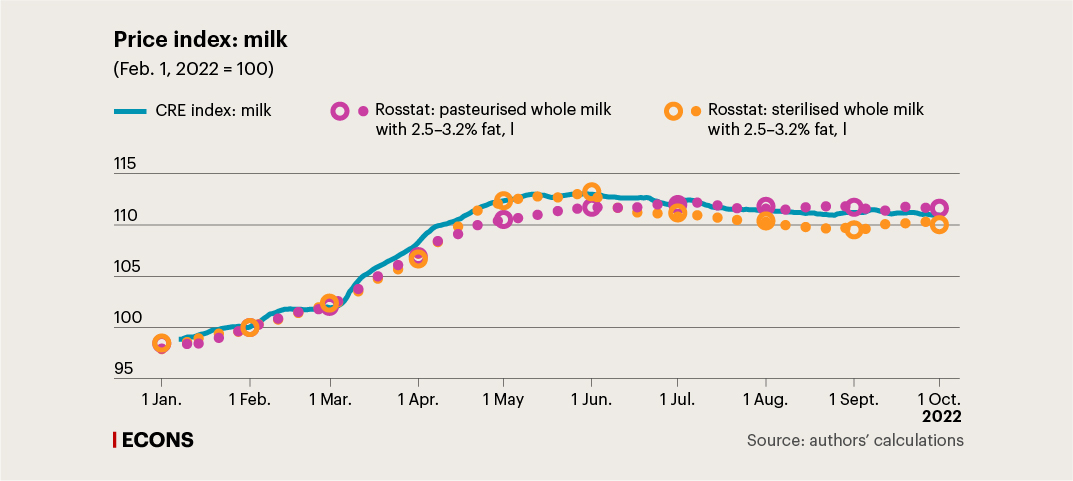
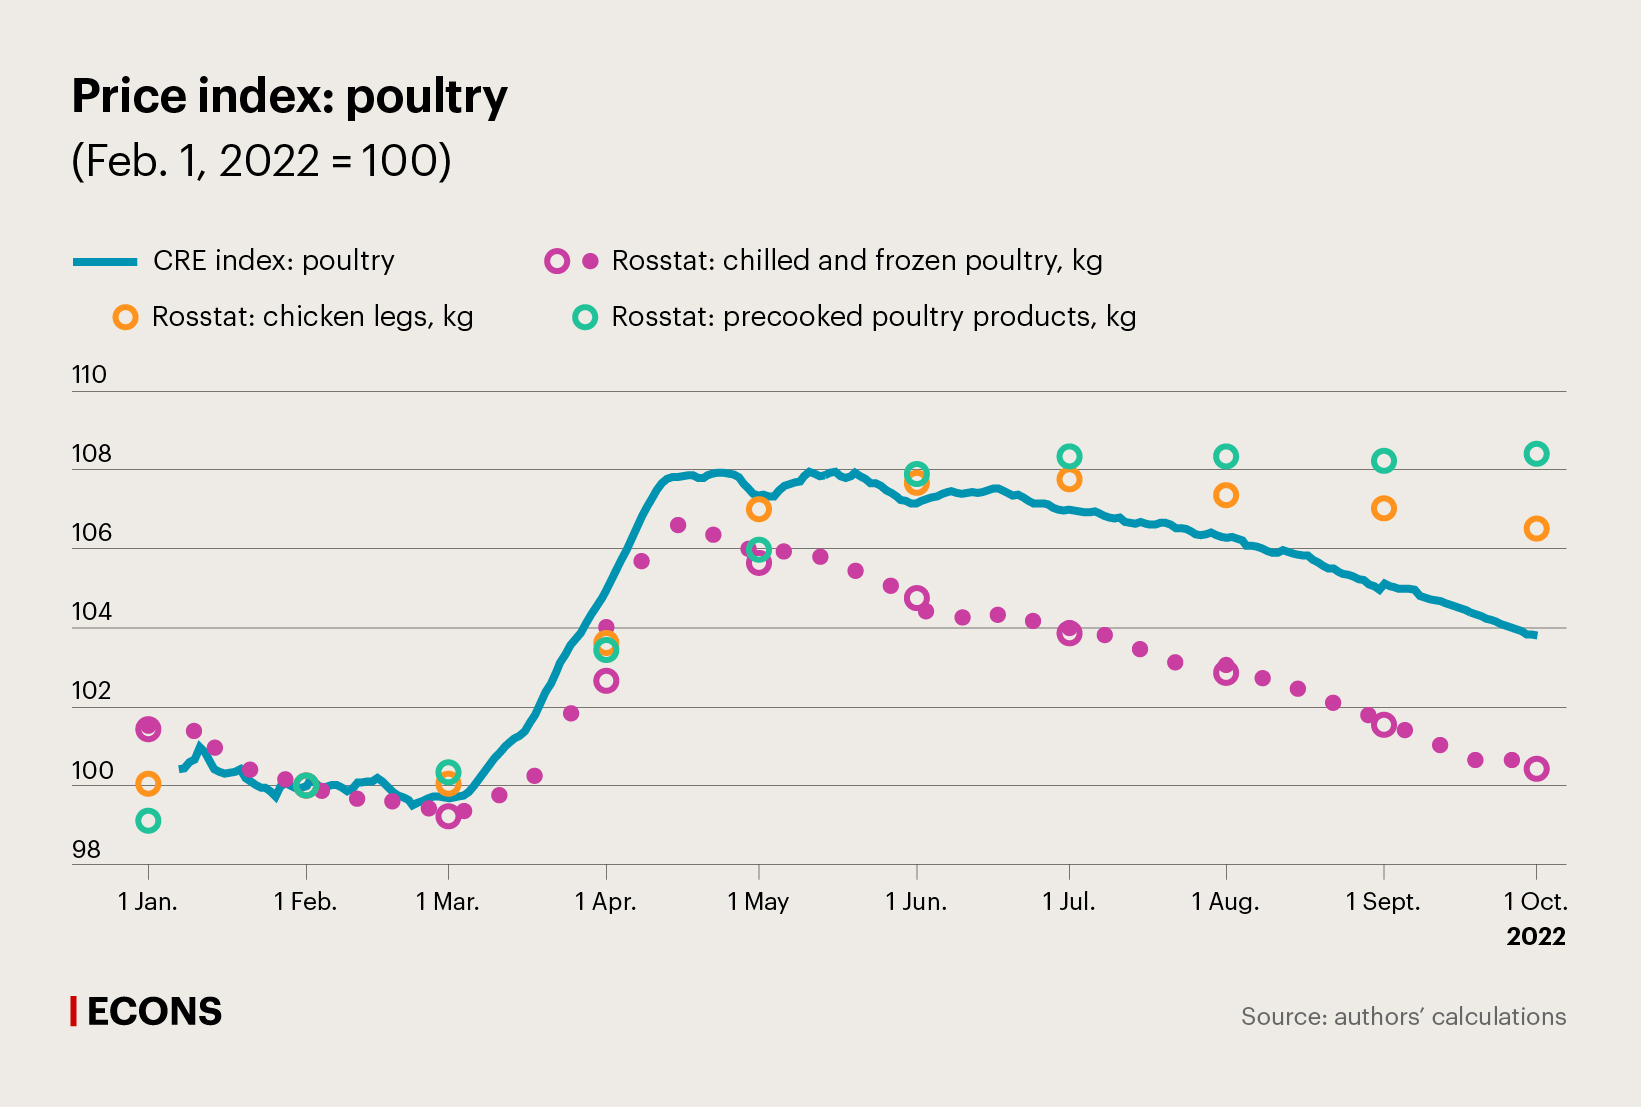
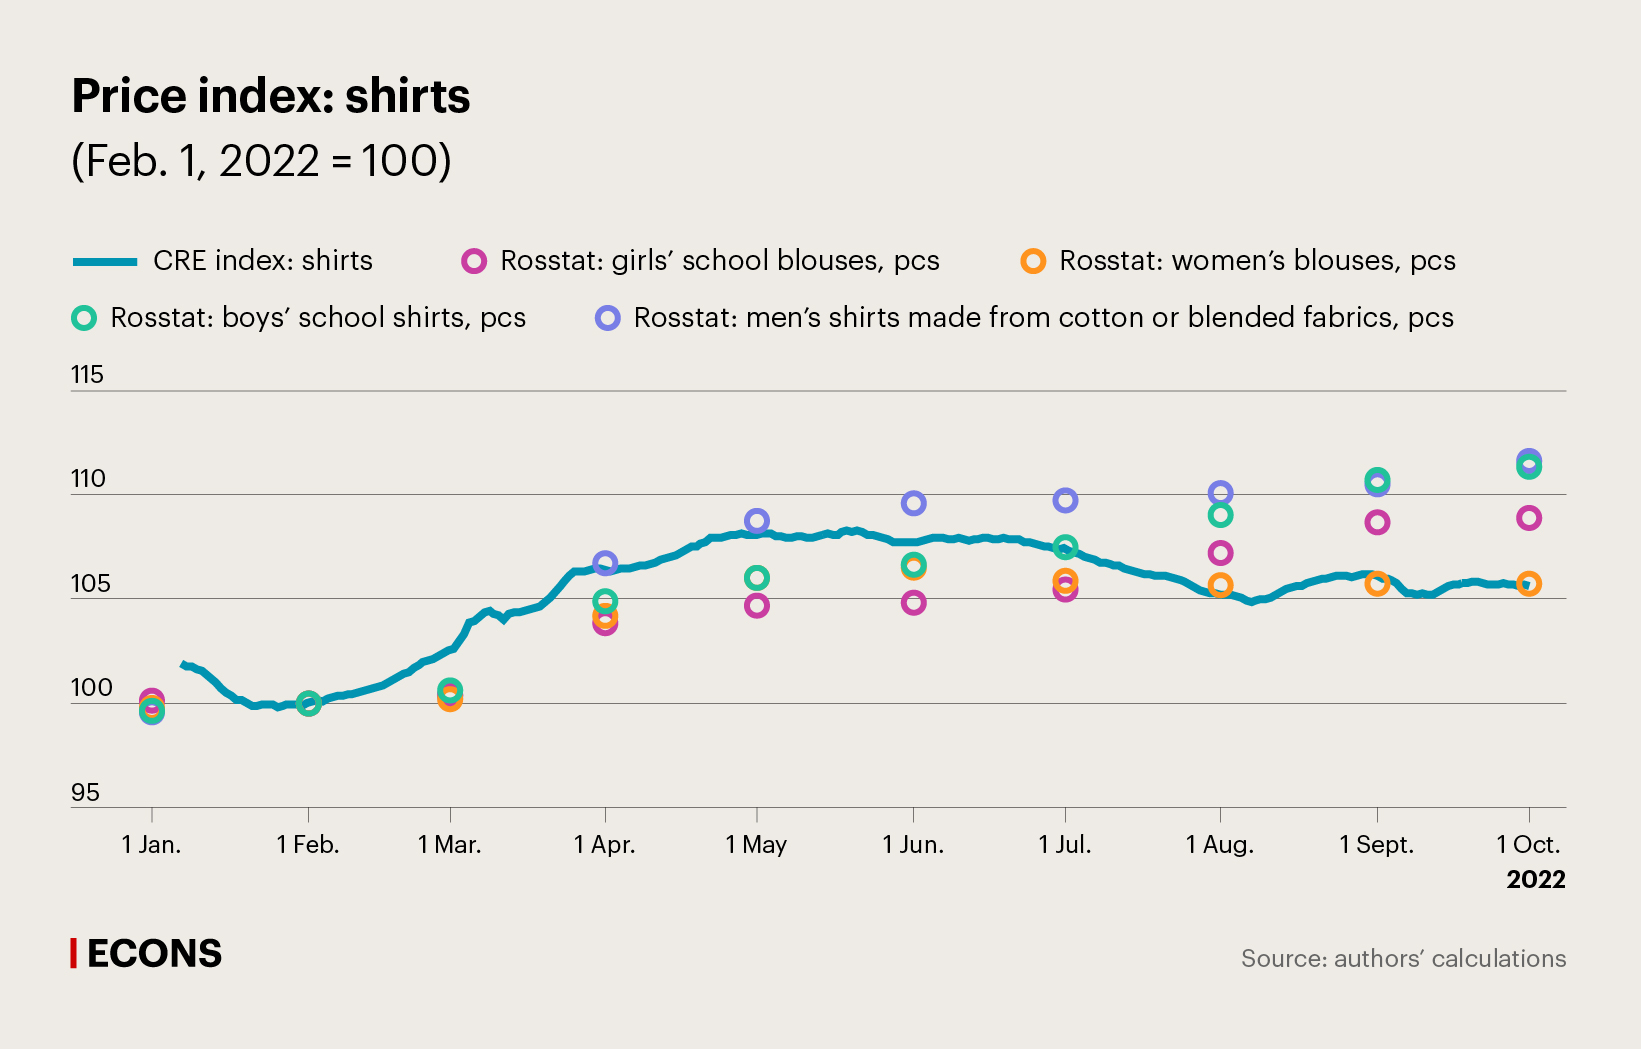
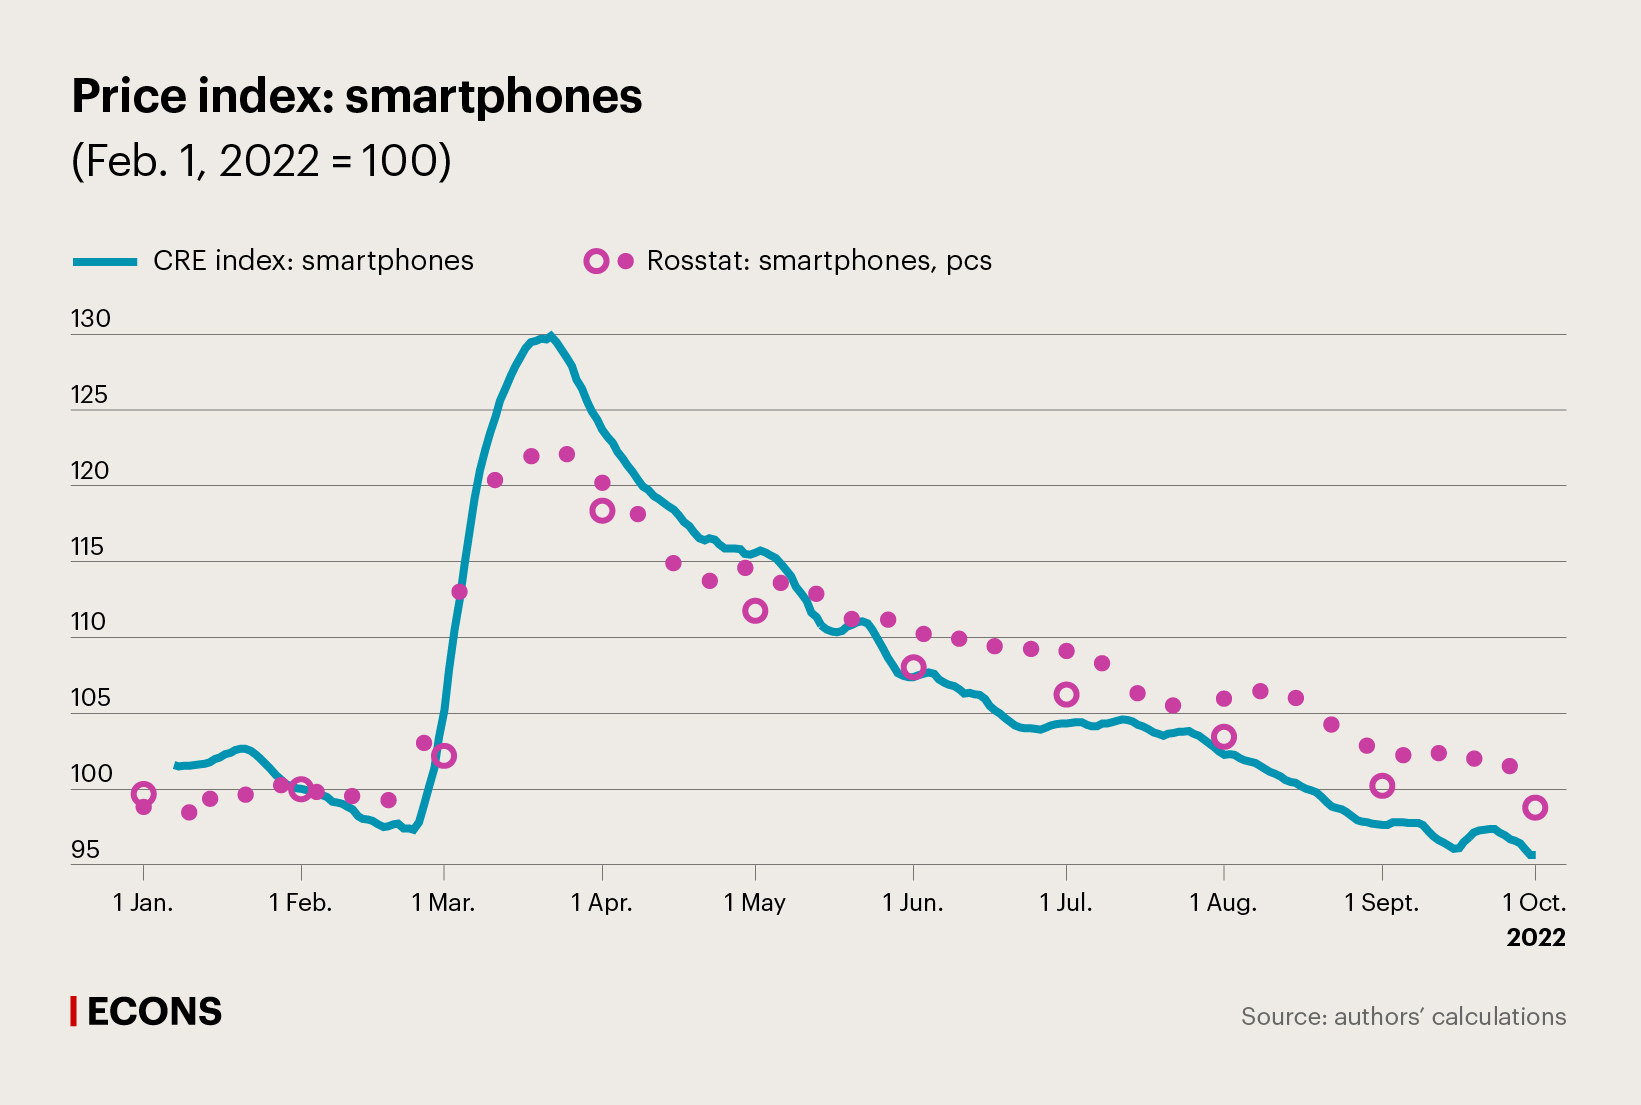
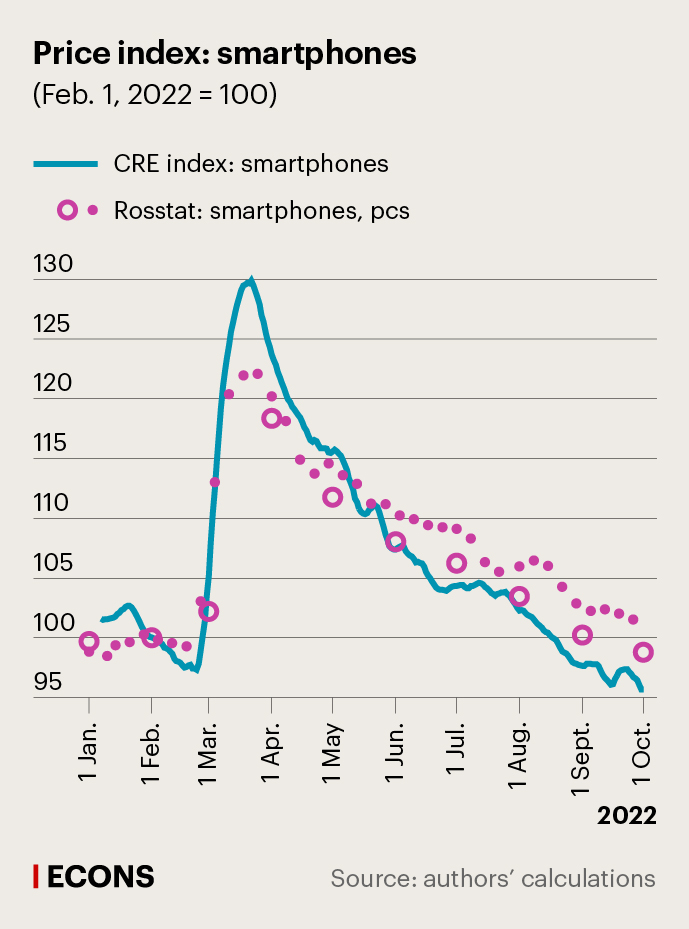
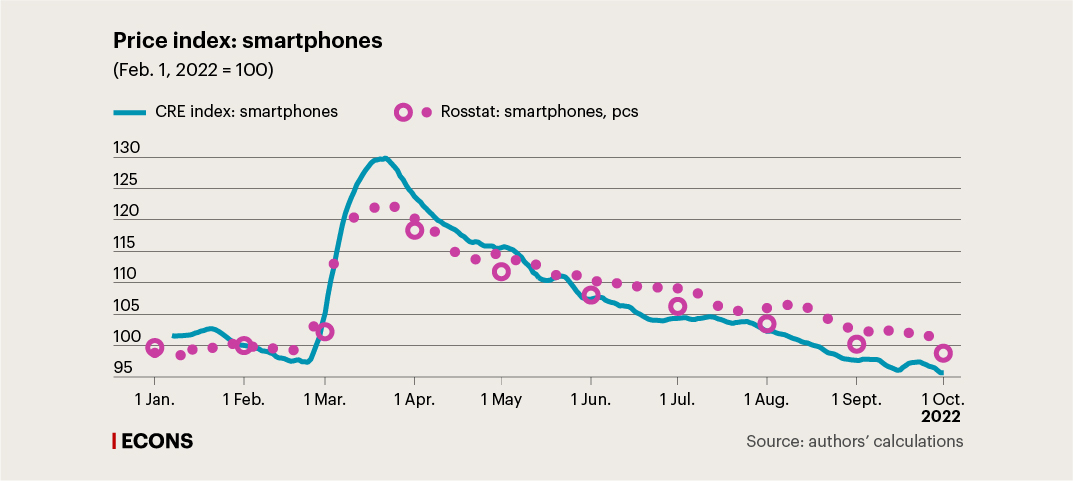
Neither the headline price index nor the individual categories show any systematic shift from the official statistics over the given period. However, the result in this case may only be deemed preliminary, since we use additional filters to calculate this index. They are designed to filter out uninformative names of items which would be filtered out in the calculation of indices for goods classified into categories. These filters allow us to efficiently ‘smooth out’ the index, although at the risk of losing certain part of informative dynamics. At the moment, we continue to work on improving the methodology for compiling the headline index.
The increasing availability of big data on retail prices, such as data from marketplaces, retailer websites, and CRE receipts, creates substantially more opportunities for studying price trends. The advantages of such data sources are already leveraged by statistical agencies and central banks in some countries. In particular, the Netherlands first started to use CRE data as a data source in 2002.
Subsequently, the number of European Union countries using this data source (or introducing it) increased from 4 in 2015 to 16 at present. One of the most striking examples of the practical application of big data is a project to calculate an online consumer price index which was implemented in Poland during the most acute phase of the COVID-19 pandemic. The Central Bank of Armenia has also been collecting online prices for quick estimates of food inflation since 2016, while researchers at the Riksbank in Sweden use online data to calculate price indices for fruit and vegetables. Rosstat is also working (link in Russian) on ways to use big data to calculate the CPI alongside the traditional sources of price data.
In the future, the use of CRE data will make it possible to create a new toolkit, which will notably augment analysts' capabilities to study inflationary processes. However, the practical implementation of this approach still poses methodological and technical challenges (improvement of classification algorithms, expansion of the structure of product categories, study of the characteristics of the index across long time series, etc.) that will need to be addressed.


