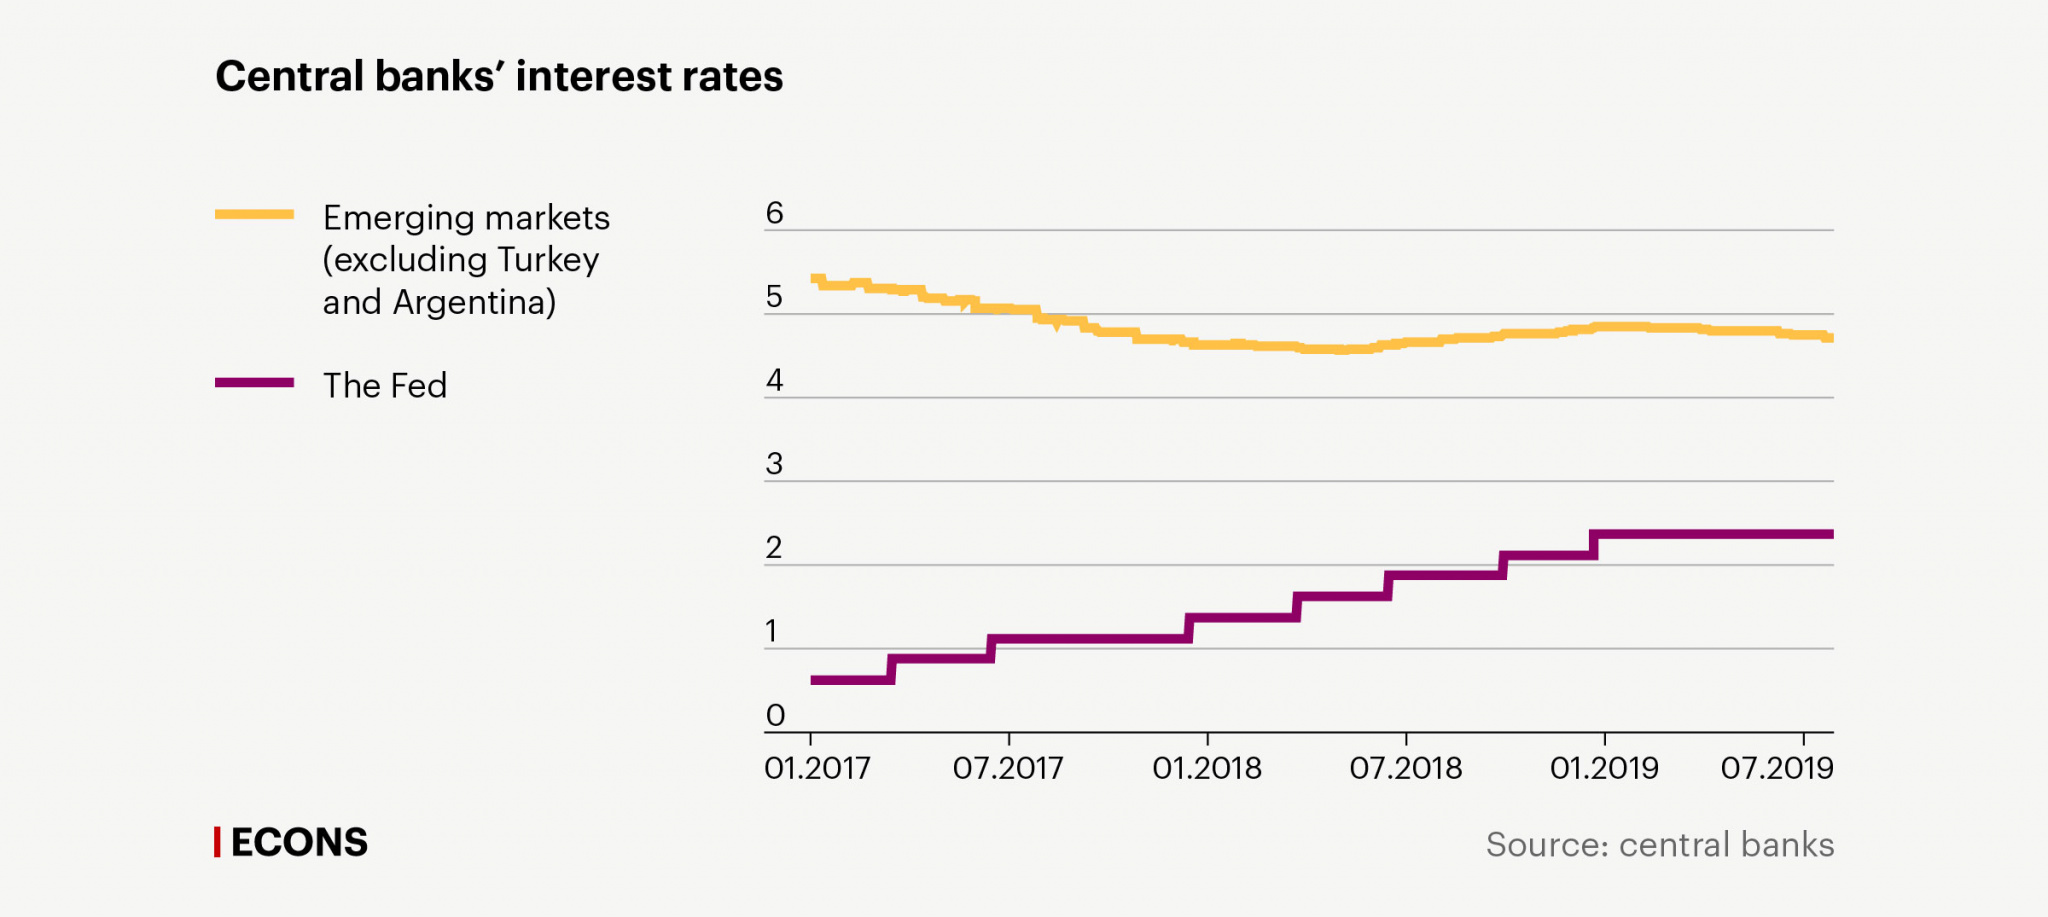
In the first half of 2019, almost all assets in global markets showed positive trends: equity markets grew in both developed and emerging economies; in the majority of countries, bond yields decreased in both national and foreign currencies; the risk premium of emerging markets went down; and volatility returned to early/mid 2018 levels. This improvement in financial conditions on global markets was the result of a shift in leading central banks’ policies: they chose looser monetary policy over monetary policy normalization (i.e. raising interest rates that had remained extremely low for almost a decade). This shift was driven by increasingly obvious signs of a global economic slowdown and by the serious risks presented by the US – China trade dispute, which was not resolved at the G20 summit in Osaka. In developed economies, inflation is still below central banks’ targets, and slower growth leads to lower inflationary pressure, all other things being equal. This is one of the reasons central banks in developed countries are acting as they are.
The global economic slowdown is currently a key threat to global financial markets. There is a real risk that circumstances will change for the worse and emerging markets will face even larger capital outflow. Nevertheless, the events of 2018 – massive capital outflow from emerging markets and increased bond yields – are unlikely to repeat themselves, for several reasons:
Chart 1.
Central banks’ interest rates
The Fed
Emerging markets (excluding Turkey and Argentina)
6
5
4
3
2
1
0
01.2017
07.2017
01.2018
07.2018
01.2019
07.2019
Source: central banks
The Fed
Emerging markets (excluding Turkey and Argentina)
6
5
4
3
2
1
0
01.2017
07.2017
01.2018
07.2018
01.2019
07.2019
Source: central banks
Emerging markets
(excluding Turkey and Argentina)
The Fed
6
5
4
3
2
1
0
01.2017
07.2017
01.2018
07.2018
01.2019
07.2019
Source: central banks
However, the steps central banks take could prove insufficient for preventing global economic slowdown. Factors that may compound the recession and make further recovery difficult persist:
1. Substantial non-financial corporate debt
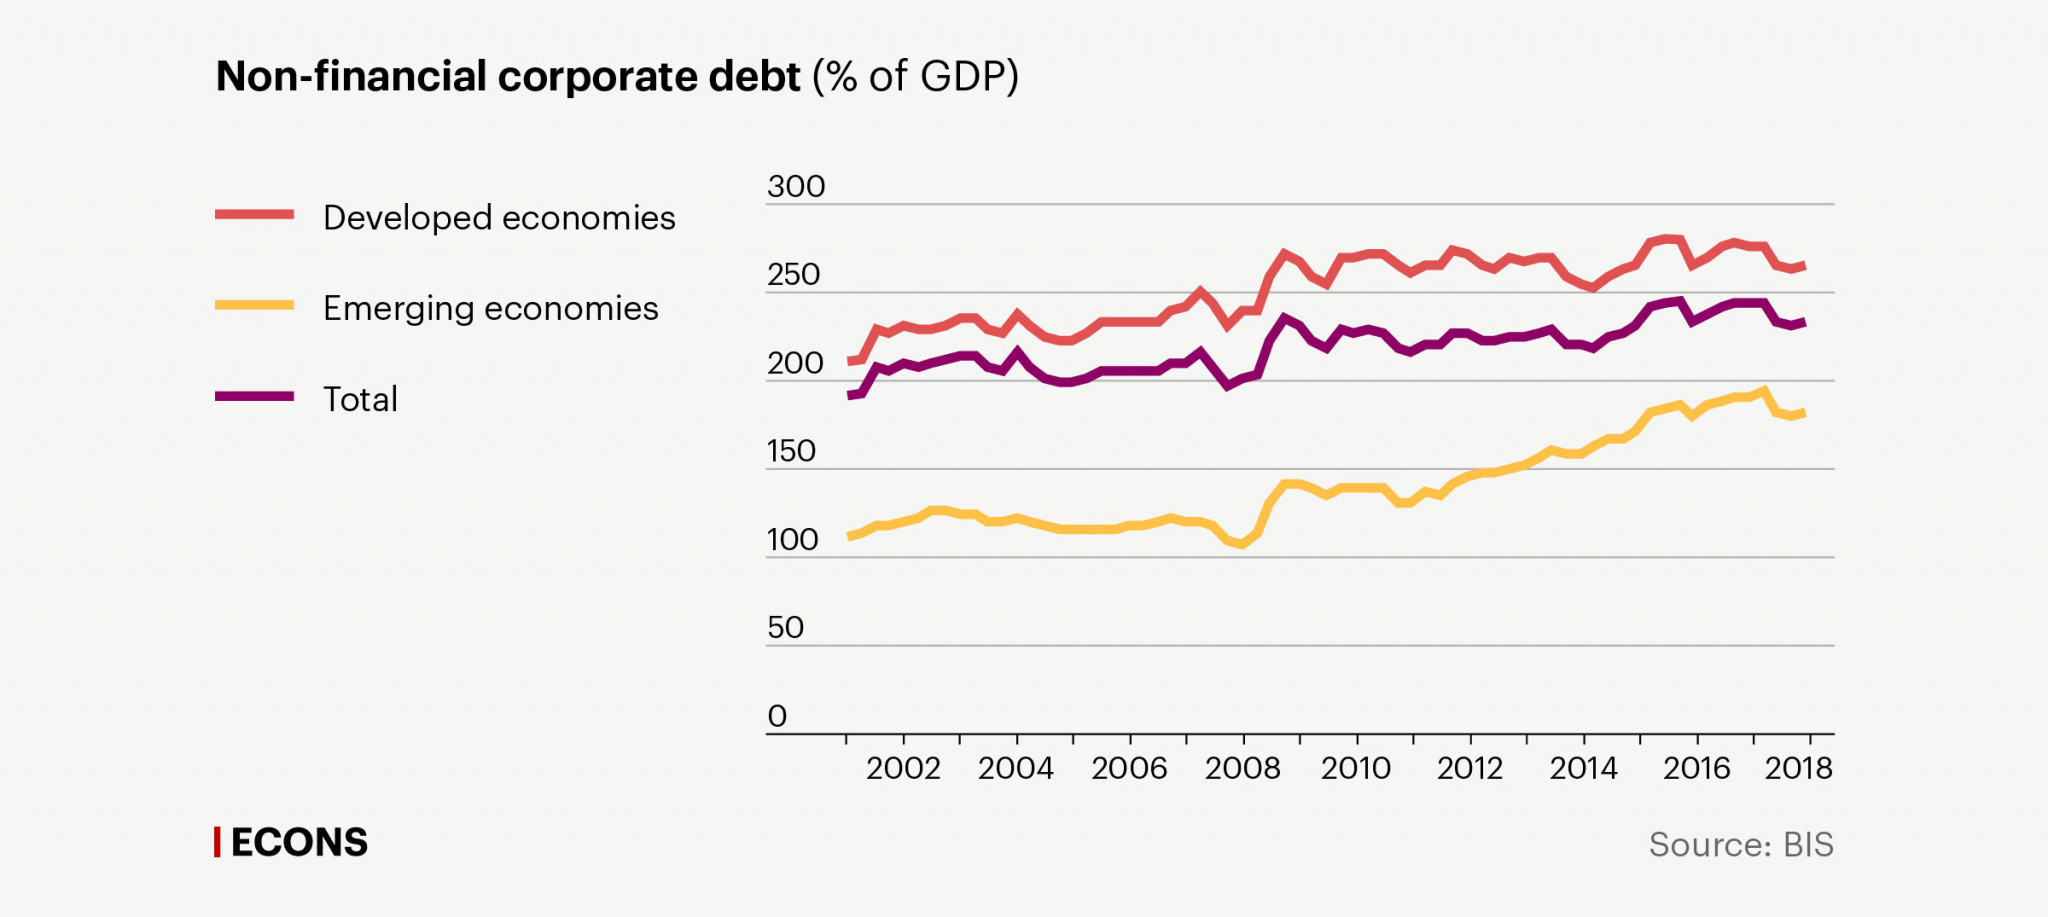
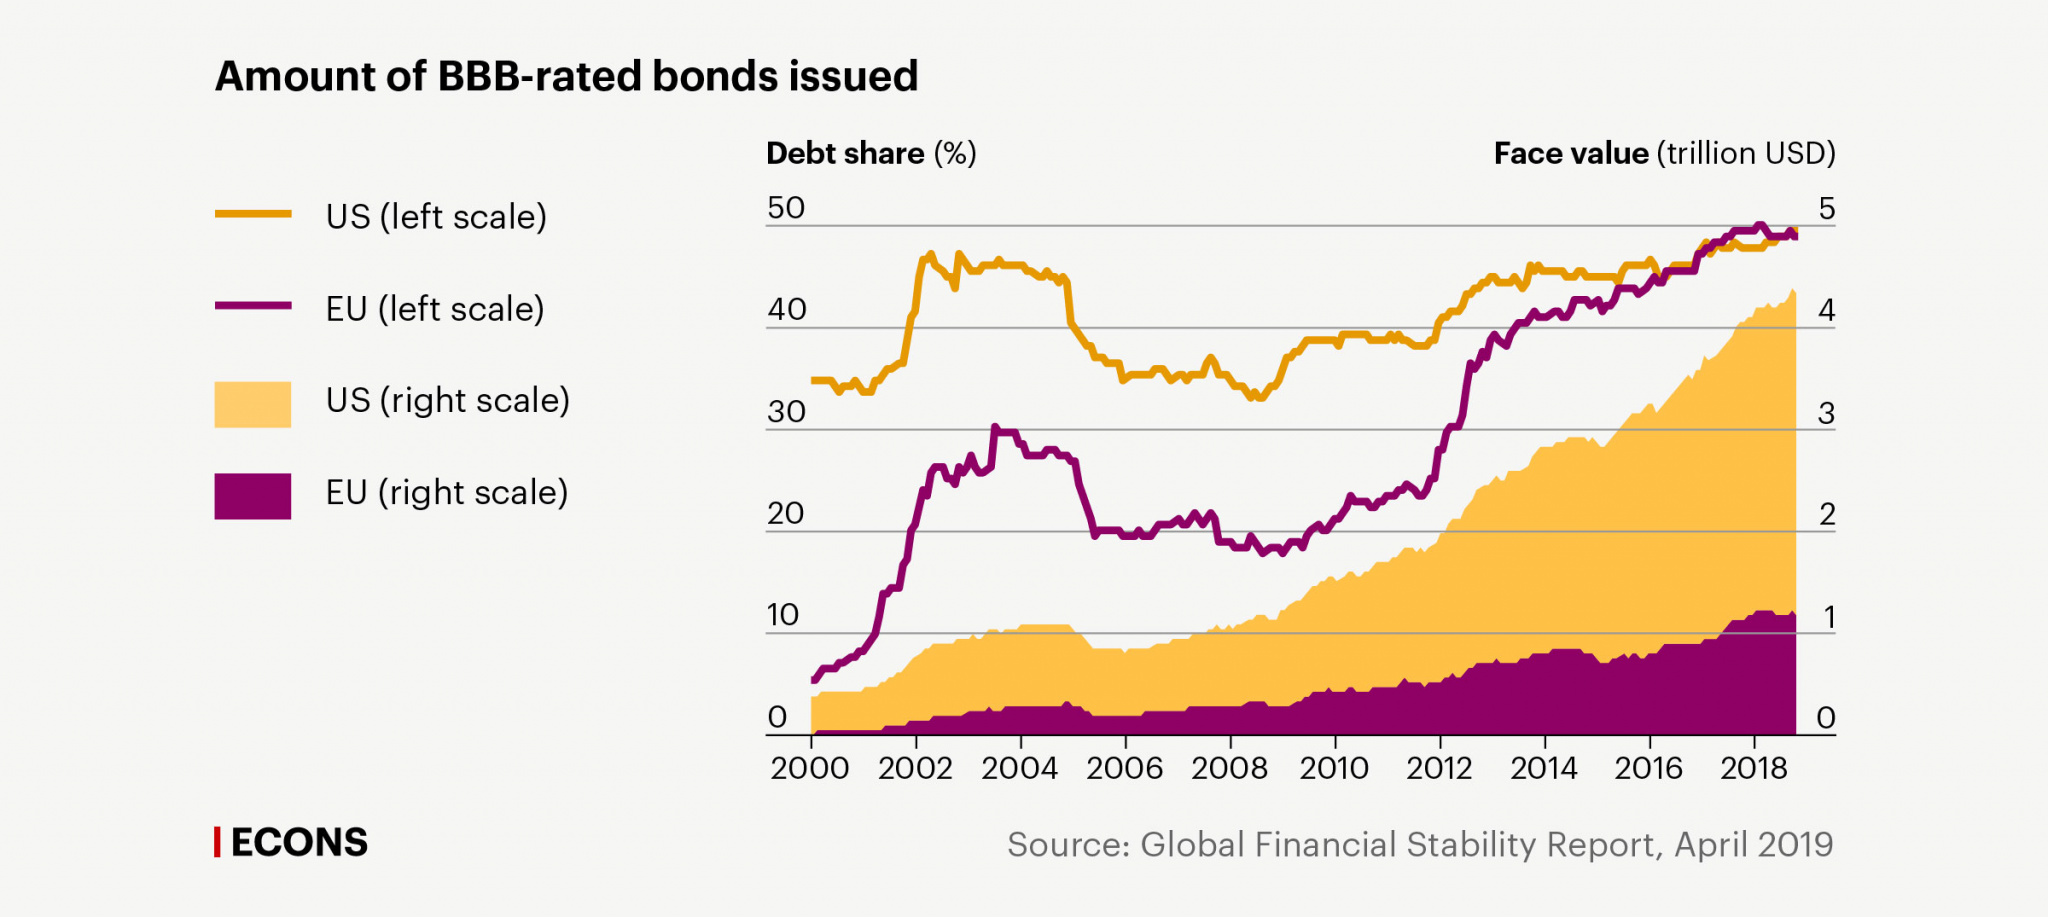
Slower global trade growth and potential further global economic slowdown are undermining the prospects for corporate profit growth. This factor could play a crucial role in asset reevaluation and increased borrowing costs for business. The lenient financial conditions that supported the economy after the global crisis resulted in record-high corporate debt (see Chart 2). Moreover, recent equity offerings are characterized by lower ratings, while issuers have higher leverage; at the same time, the proportion of BBB bonds in investment-grade debt has risen (see Chart 3).
Chart 2.
Non-financial corporate debt (% of GDP)
Total
Developed economies
Emerging economies
300
250
200
150
100
50
0
2001
2002
2003
2004
2005
2006
2007
2008
2009
2010
2011
2012
2013
2014
2015
2016
2017
2018
Source: BIS
Developed economies
Total
Emerging economies
300
250
200
150
100
50
0
2002
2004
2006
2008
2010
2012
2014
2016
2018
Source: BIS
Developed economies
Emerging economies
Total
300
250
200
150
100
50
0
2002
2006
2010
2014
2018
Source: BIS
In the event of another global recession, reevaluation of companies’ prospects – in the real and financial sectors as well as the private and public sectors – will lead to higher borrowing costs, refinancing problems, and massive downgrades. Lack of room for manoeuvre in certain leading countries’ fiscal policy (due to substantial public debt and/or weak political will) and monetary policy (due to low interest rates) could intensify the negative impact of poor credit quality on economic performance. As a result, economic recovery could take a relatively long time.
Chart 3.
Amount of BBB-rated bonds issued
US (left scale)
US (right scale)
EU (left scale)
EU (right scale)
Debt share (%)
Face value (trillion USD)
50
5
40
4
30
3
20
2
10
1
0
0
2000
2002
2004
2006
2008
2010
2012
2014
2016
2018
Source: Global Financial Stability Report, April 2019
US (left scale)
US (right scale)
EU (left scale)
EU (right scale)
Debt share (%)
Face value (trillion USD)
50
5
40
4
30
3
20
2
10
1
0
0
2000
2002
2004
2006
2008
2010
2012
2014
2016
2018
Source: Global Financial Stability Report, April 2019
US (left scale)
EU (left scale)
US (right scale)
EU (right scale)
Face value
(trillion USD)
Debt share (%)
50
5
40
4
30
3
20
2
10
1
0
0
2002
2006
2010
2014
2018
Source: Global Financial
Stability Report, April 2019
2. High volatility of capital inflow in emerging economies
According to the IMF, over the last decade, portfolio investment benchmarked against widely followed emerging market bond indices has grown by a factor of four, to 800 billion USD. The IMF estimates that about 70% of investment in emerging economies is volatile and responds swiftly to changes in market mood and global financial conditions. This investment can play a significant role in external shock transmission.
If the global economy plunges into another recession, capital will leave emerging economies for defensive assets, i.e. developed economies. Emerging markets will face sudden capital stops that usually lead to exchange rate decreases, thereby increasing the debt burden of borrowers and cutting credit, internal demand, and output. This risk is particularly relevant for countries with substantial foreign currency debt.
3. Real estate boom
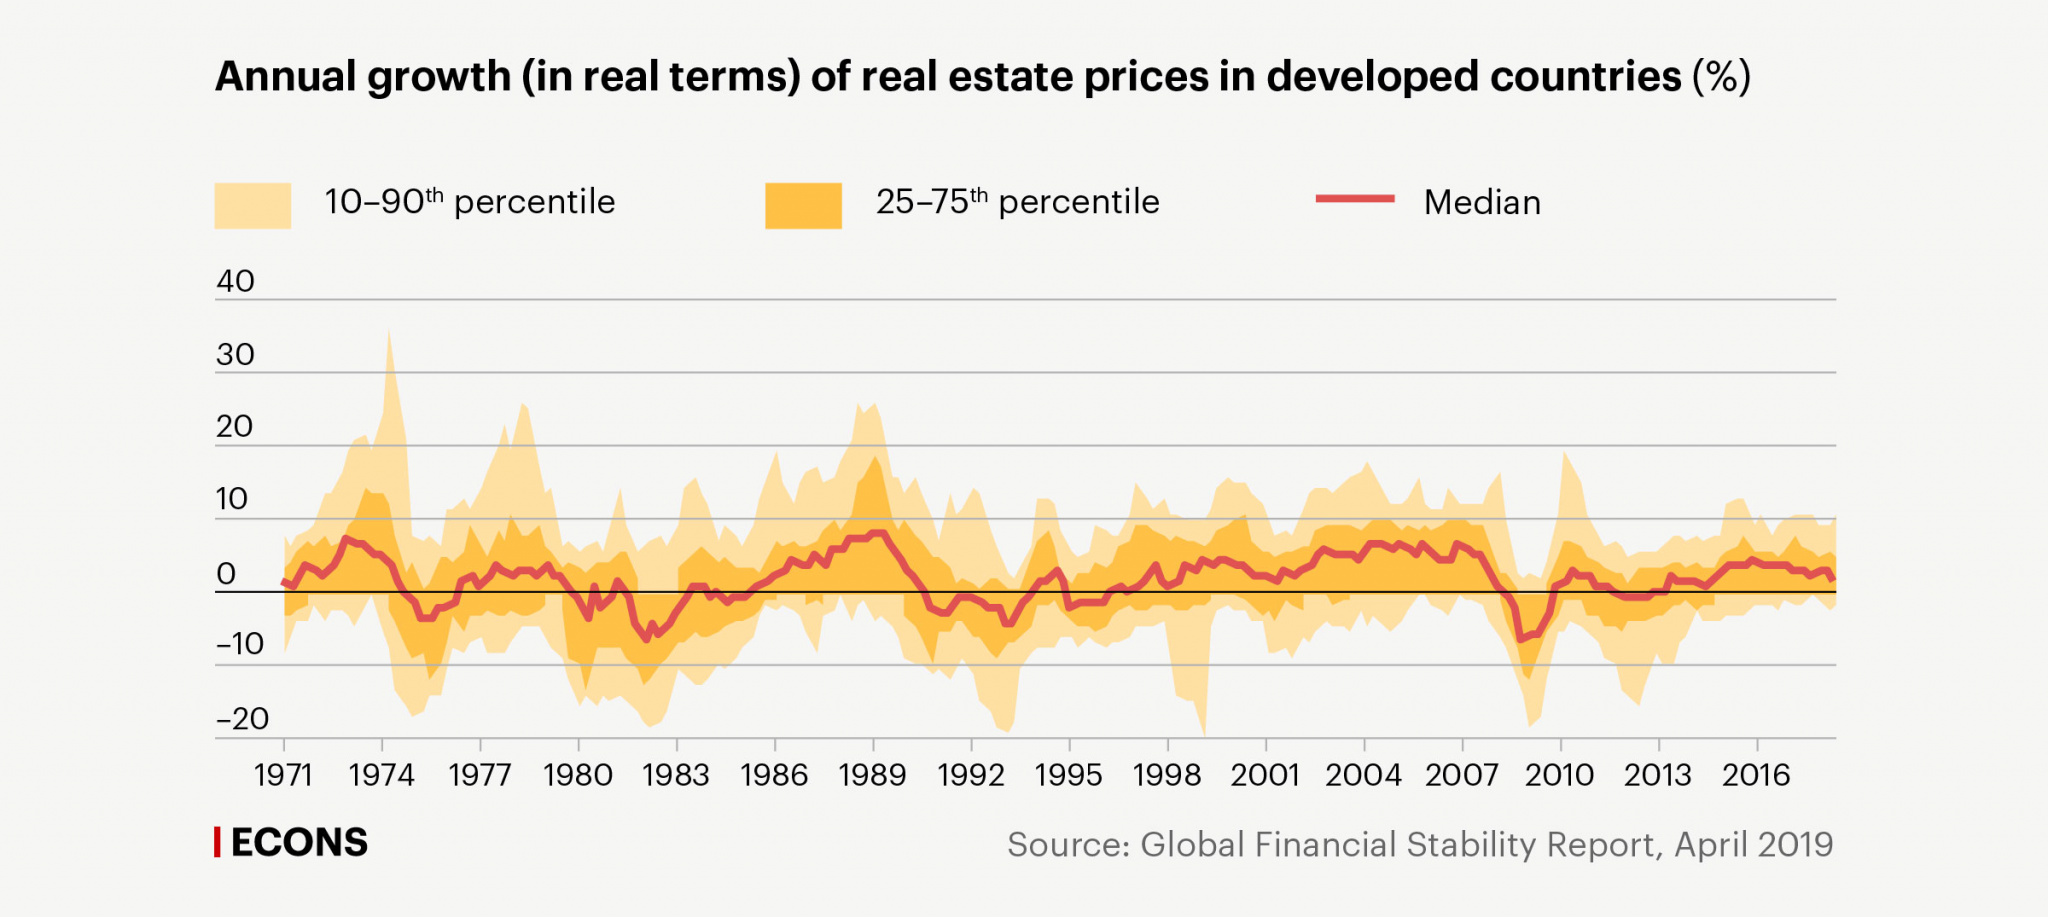
Over the last five years, some countries have experienced growth in real estate prices (for example, housing prices in Hong Kong, Sweden, and Ireland gained on average 5% or more each year from 2013 until 2018), which requires regulators in these countries to take additional measures, primarily in macroprudential policy. Given the increased synchrony in housing price dynamics across countries (see Chart 5), there is a risk of a synchronous fall in real estate prices.
Sharp price adjustments may hinder businesses’ access to funding (commercial property often serves as collateral for corporate loans; housing and commercial property prices correlate) as well as have a negative impact on consumption and generate problems in the banking sector. Housing prices are closely linked with macroeconomic and financial stability. Empirical studies show that recessions aggravated by falls in real estate prices are deeper and longer. As a result, in the event of global recession, countries experiencing a real estate boom are likely to suffer more than other countries.
Chart 4.
Average annual real estate price growth in economies and cities in 2013–2018:Q2 (%)
City
Economy
Ireland/Dublin
New Zealand/Auckland
Australia/Sydney
Canada/Toronto
Norway/Oslo
Denmark/Copenhagen
Great Britain/London
The Netherlands/Amsterdam
Sweden/Stockholm
German/Berlin
Hong Kong/Urban areas
Japan/Tokyo
Switzerland/Zurich
Austria/Vienna
Belgium/Brussels
USA/New York
Spain/Madrid
France/Paris
South Korea/Seoul
Singapore/Core central region
Italy/Rome
–4
–3
–2
–1
0
1
2
3
4
5
6
7
8
9
10
11
Source: Global Financial Stability Report, April 2019
City
Economy
Ireland/Dublin
New Zealand/Auckland
Australia/Sydney
Canada/Toronto
Norway/Oslo
Denmark/Copenhagen
Great Britain/London
The Netherlands/Amsterdam
Sweden/Stockholm
German/Berlin
Hong Kong/Urban areas
Japan/Tokyo
Switzerland/Zurich
Austria/Vienna
Belgium/Brussels
USA/New York
Spain/Madrid
France/Paris
South Korea/Seoul
Singapore/Core central region
Italy/Rome
–4
–2
0
2
4
6
8
10
Source: Global Financial
Stability Report, April 2019
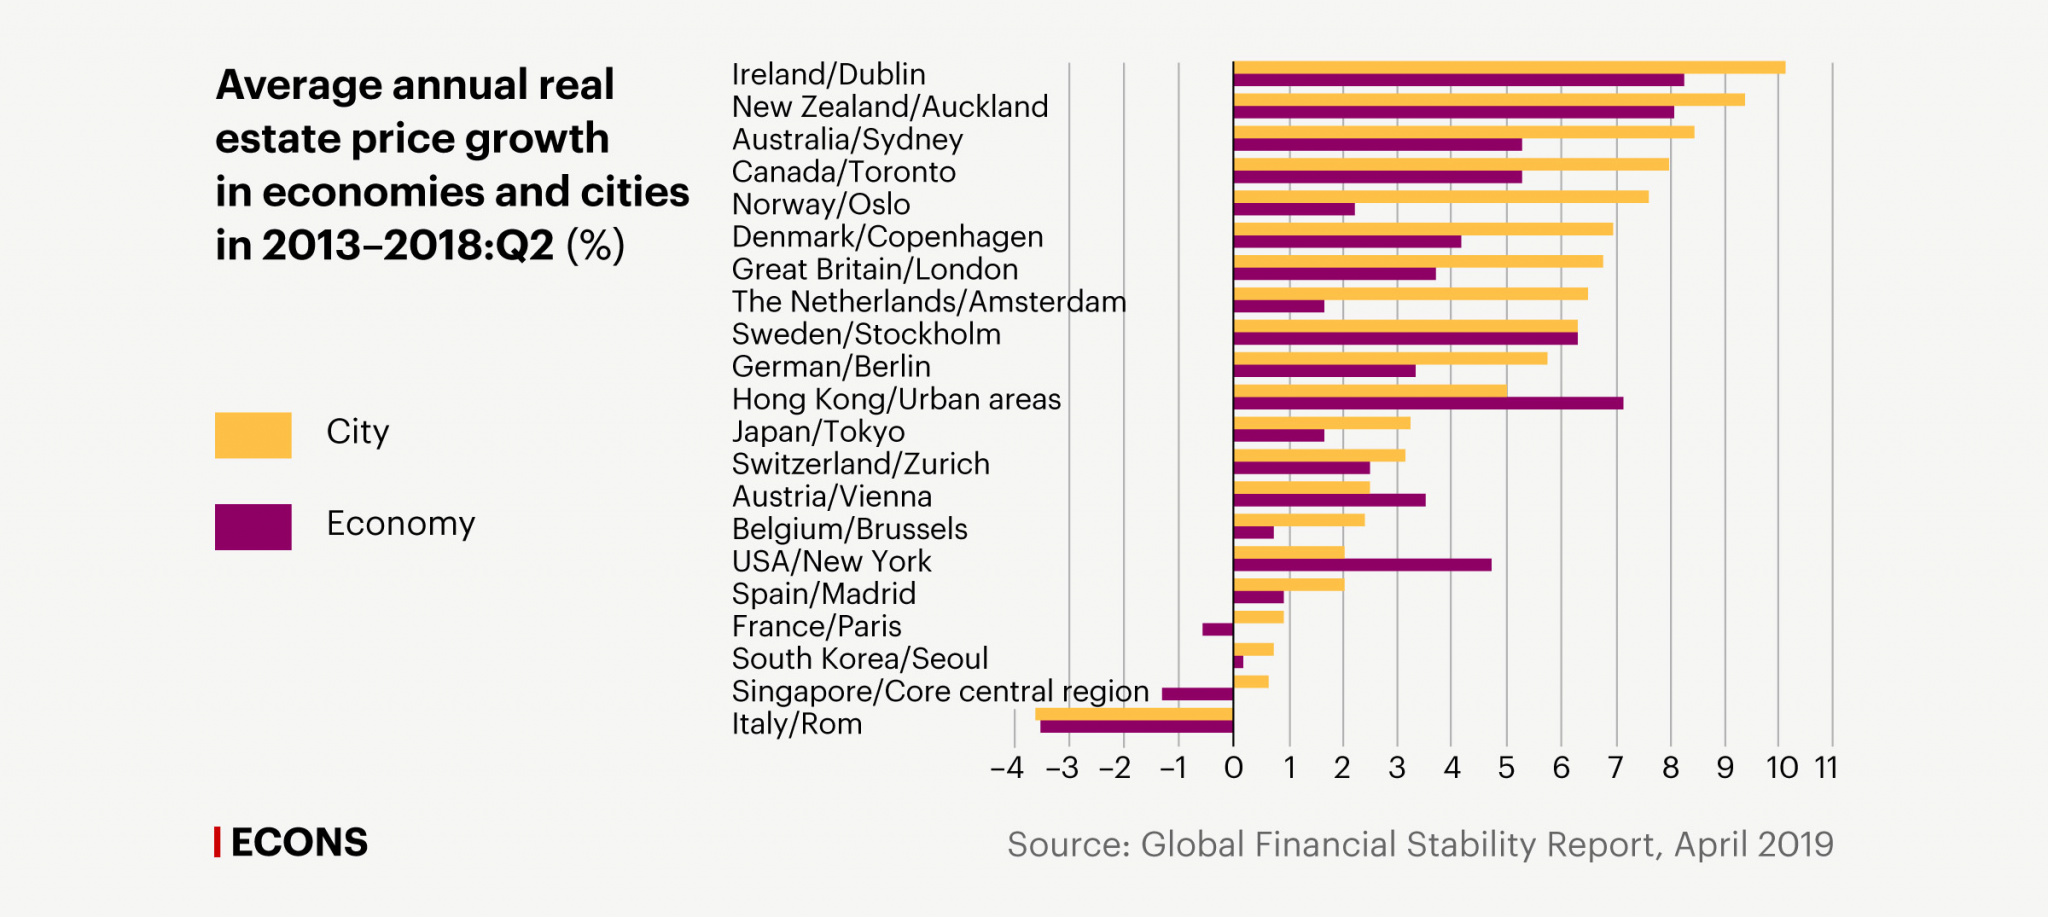
Chart 5.
Annual growth (in real terms) of real estate prices in developed countries (%)
10–90th percentile
25–75th percentile
Median
40
30
20
10
0
–10
–20
1971
1974
1977
1980
1983
1986
1989
1992
1995
1998
2001
2004
2007
2010
2013
2016
Source: Global Financial Stability Report, April 2019
10–90th percentile
25–75th percentile
Median
40
30
20
10
0
–10
–20
1974
1980
1986
1992
1998
2004
2010
2016
Source: Global Financial Stability Report, April 2019
10–90th percentile
25–75th percentile
Median
40
30
20
10
0
–10
–20
1971
1980
1989
1998
2007
2016
Source: Global Financial
Stability Report, April 2019
