Using Unconventional Data to Deal with an Unconventional Crisis
The economic shock caused by the pandemic is unique in many ways: not only concerning the depth of the economic decline but also concerning the speed of the crisis and its quite different impact on various sectors of the economy. In times like these, conventional macroeconomic statistics do not keep up with the changes: economists and statisticians around the world have had to update economic activity indices weekly and often daily, as the deteriorating economic situation has required active and informed decisions from all governments.
Various types of higher-frequency data (that is, data collected with high frequency in real-time), including financial transaction data, are already used in the operational analysis in many countries around the world. In Russia, one of these instruments is the analysis of data from the national payment system (NPS) of the Bank of Russia, which allows for almost real-time monitoring of the situation in various industries on a daily basis. Since mid-April, the Bank of Russia has been releasing weekly analytical publications (in Russian) containing our estimates of businesses' financial flows on a disaggregated basis by sector and region. At of the panels at the Bank of Russia's Post-Coronavirus Economy and Challenges to Central Bank Policies online conference, which took place on 9–10 December, focused on analysing and forecasting the economic effects of the coronavirus pandemic using alternative data, including higher-frequency data.
A new indicator
The Bank of Russia’s national payment system is a natural source of daily data covering all aspects of the country's economy and around half of all ruble transactions by companies. Our goal was to create an indicator that would use these data to monitor payments at the industry level in a real-time mode.
We calculate incoming flows and regard them as a proxy for gross revenues for goods and services. Then, we compare these dynamics with ‘normal’ pre-pandemic levels (we use seasonally adjusted average daily payments in the period from 20 January to 13 March 2020). Deviations from these levels during the crisis reflect the scale and structure of the decline while following the lifting of the restrictions, they allow the evaluation of the recovery trend and its homogeneity across sectors.
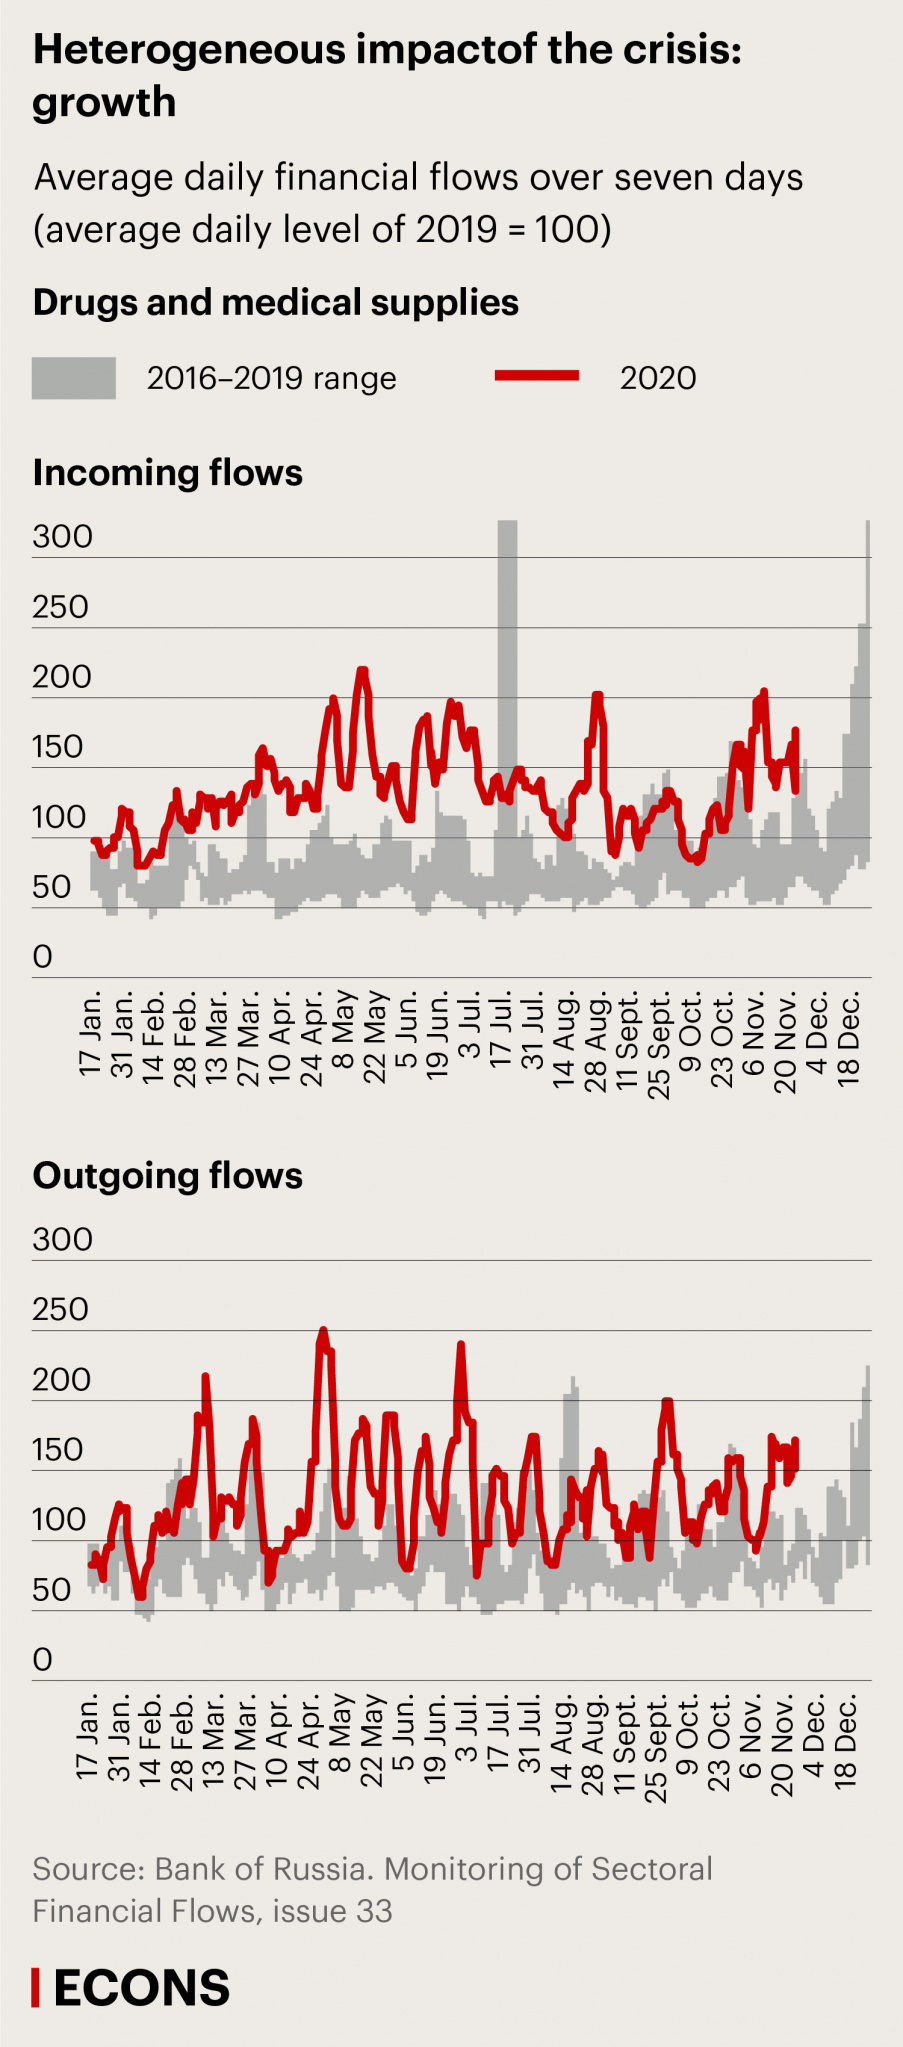
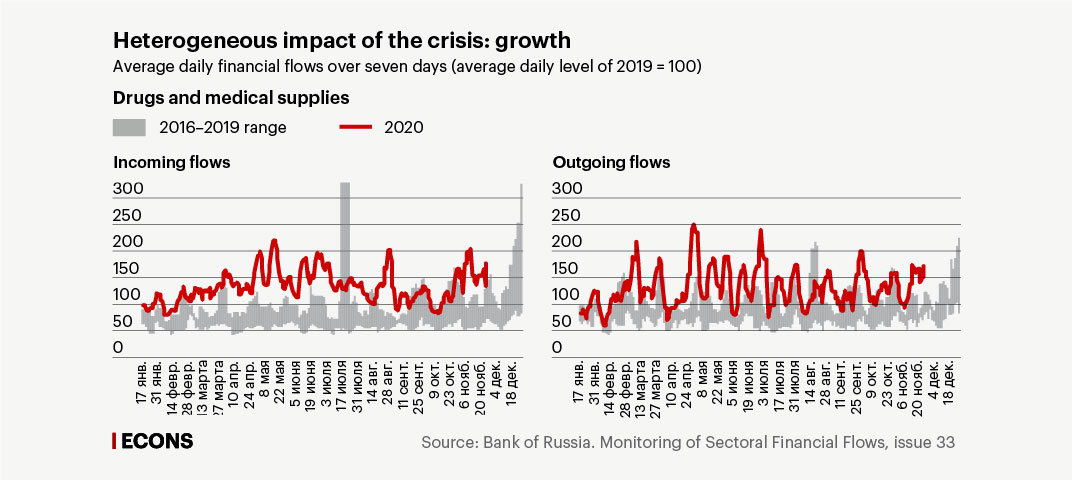
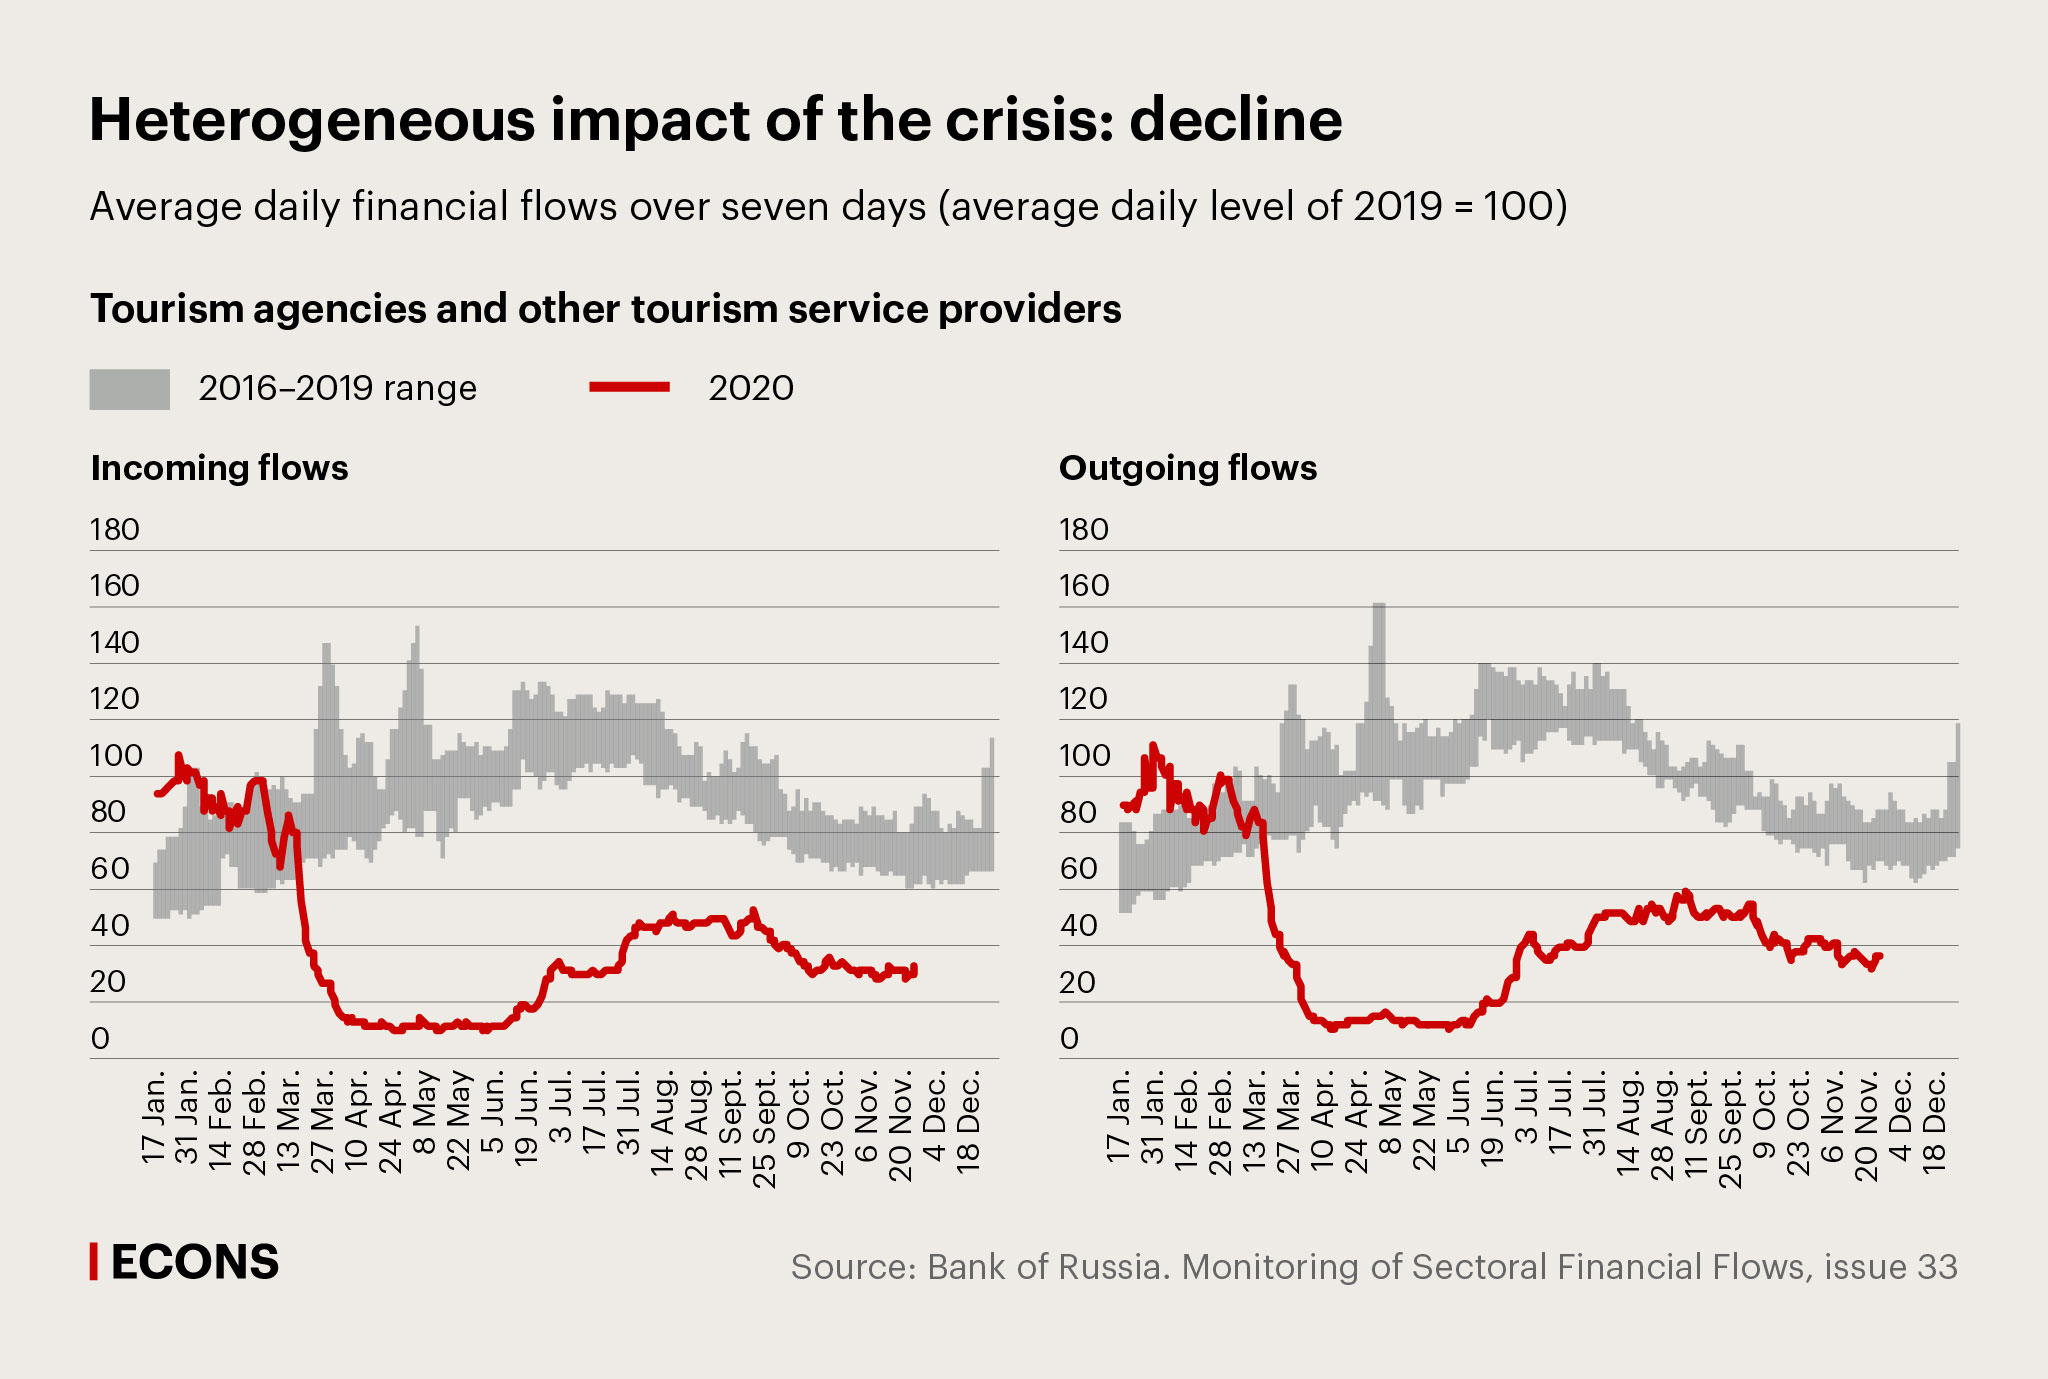
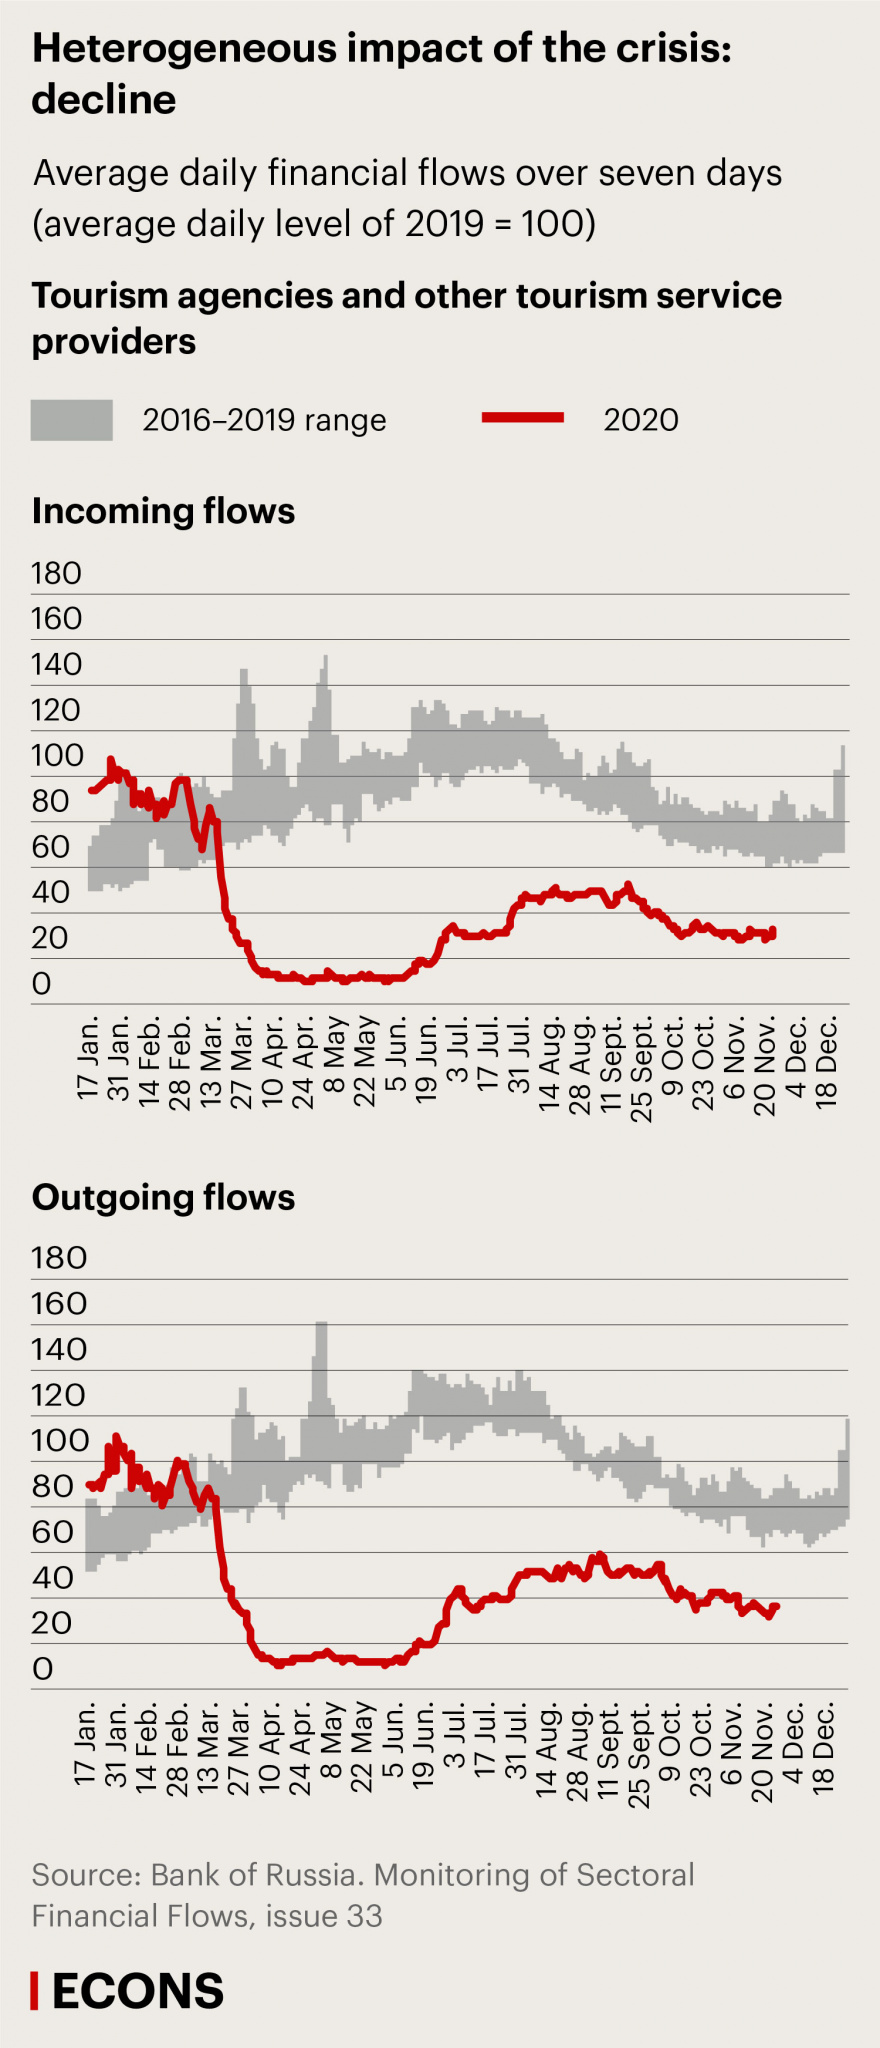
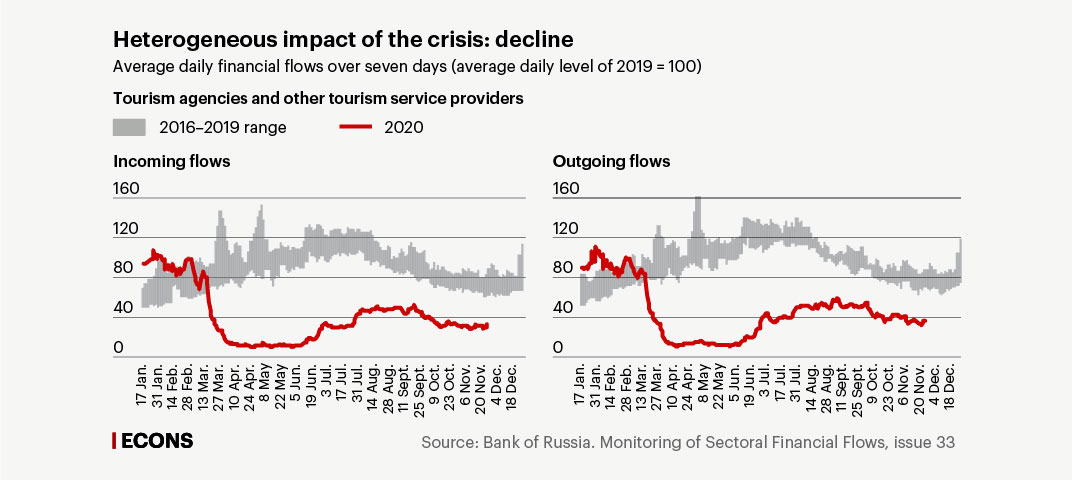
Another indicator is a comparison between the actual data and average financial flows in the same periods in 2016–2019. The charts published in the 'Monitoring of Sectoral Financial Flows' analytical publication (in Russian) show these data as a range of averages in grey, with red lines showing the incoming and outgoing financial flows in the current year.
In addition to sales revenues, incoming flows include some purely financial transactions related to various aspects of doing business, such as mergers and acquisitions. However, these transactions are one-time events reflected by noticeable spikes in incoming flows. For the rest of the time, we see the usual financial pulse of the industries.
For example, consumer-oriented industries register an increase in incoming flows when demand is high and stagnation when demand is low. The 2016–2019 average levels are usually much higher during the May holidays and right before New Year’s, which makes the anomalies of this year even more pronounced: on the charts (see below), the red lines reflecting the average level of incoming financial flows in the current year do not correspond to the grey areas showing how average incoming flows are usually distributed over time but follow their own course defined by the reality of the coronavirus crisis. For example, in this chart, we see a sudden peak at the end of March, associated with the feverish demand for food at the beginning of the quarantine.
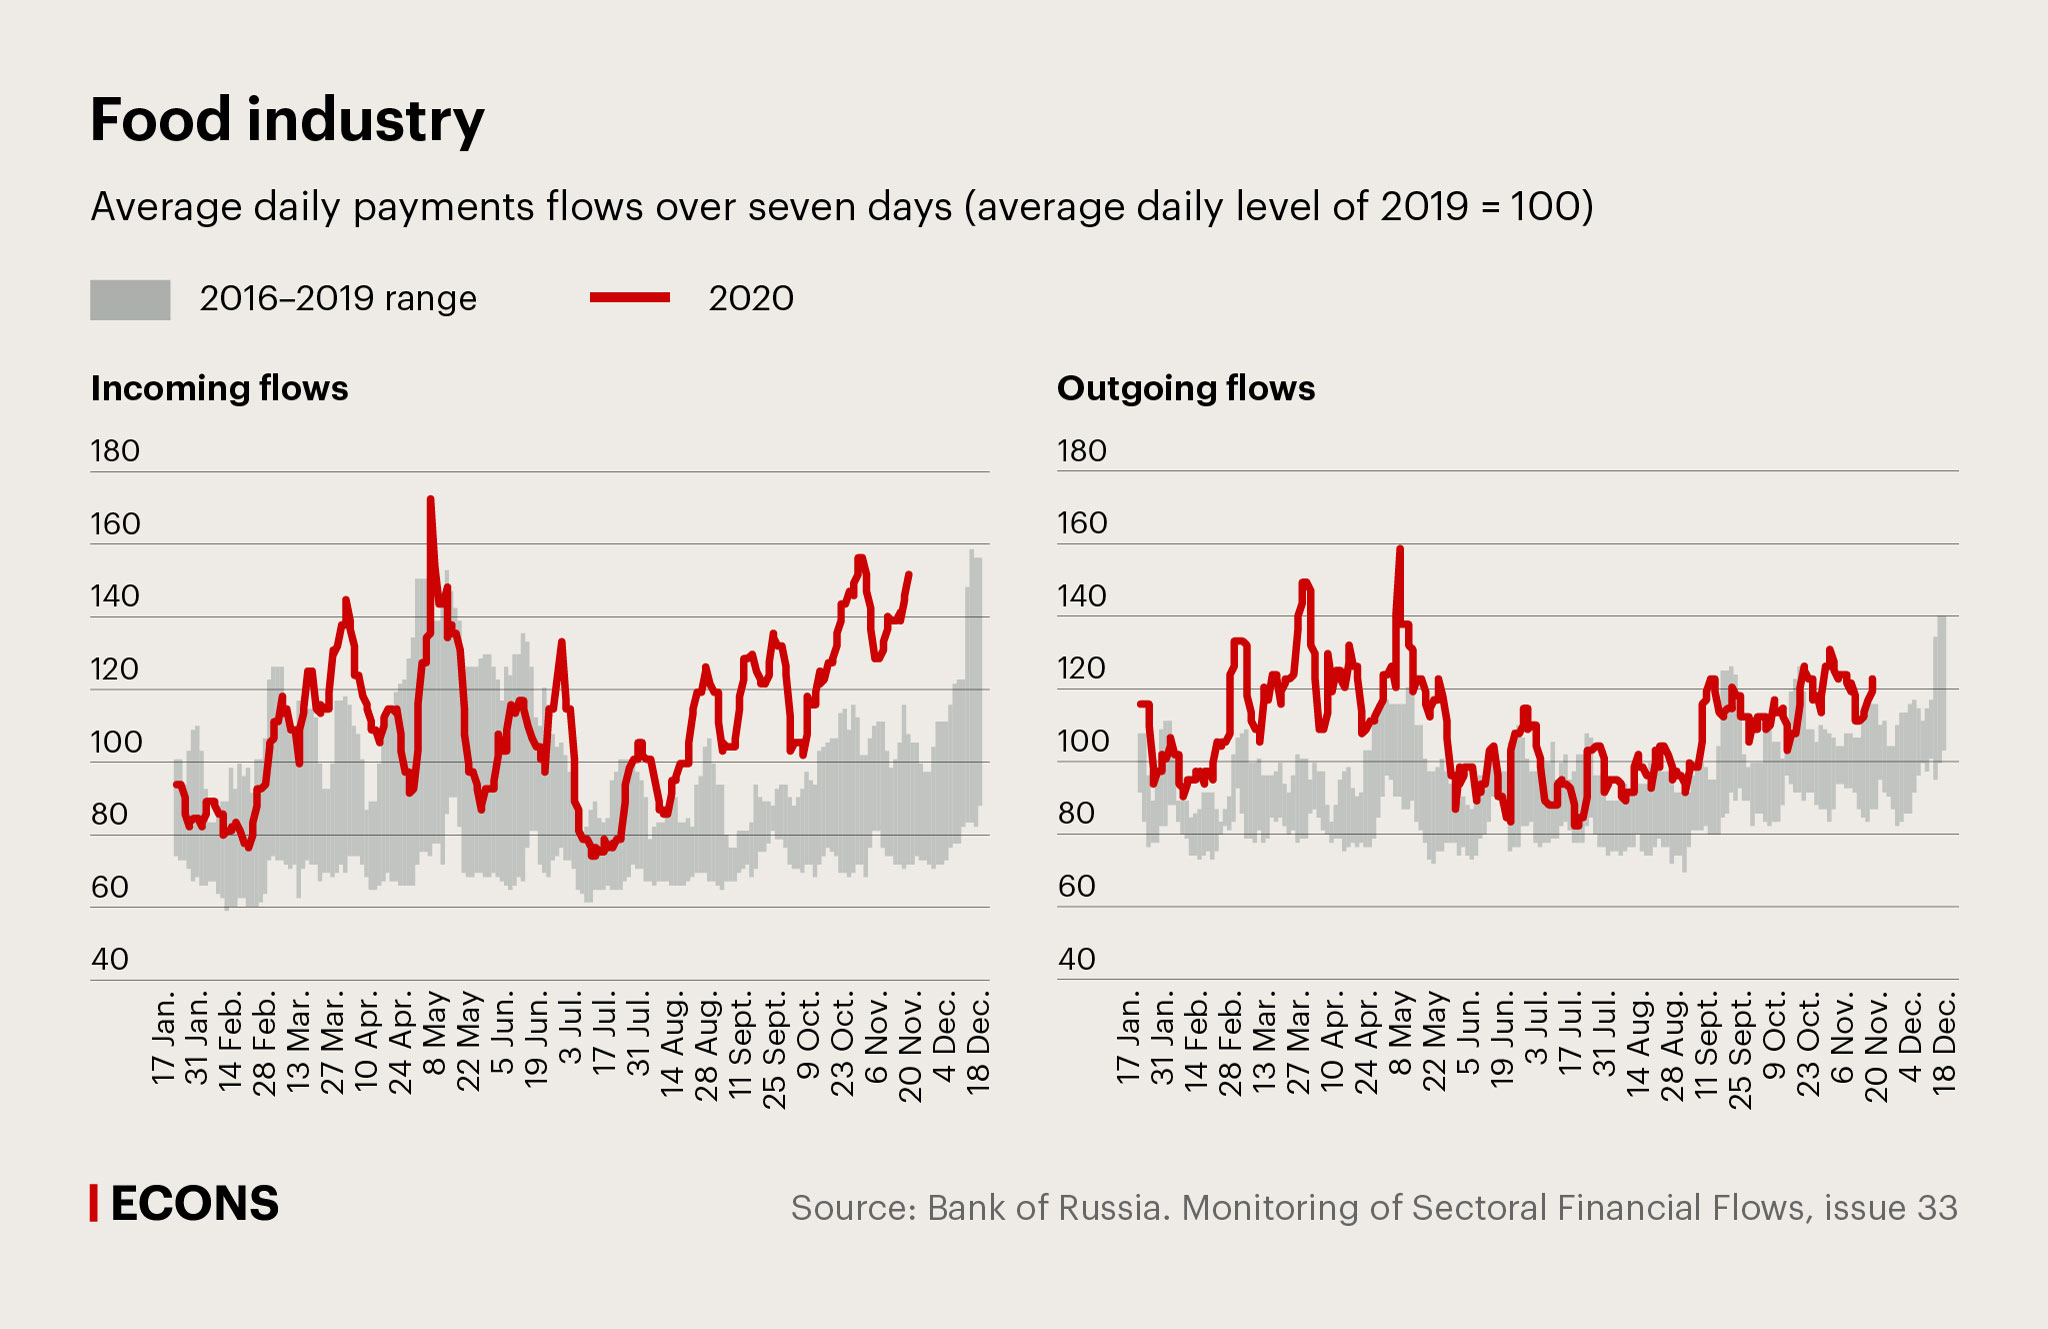
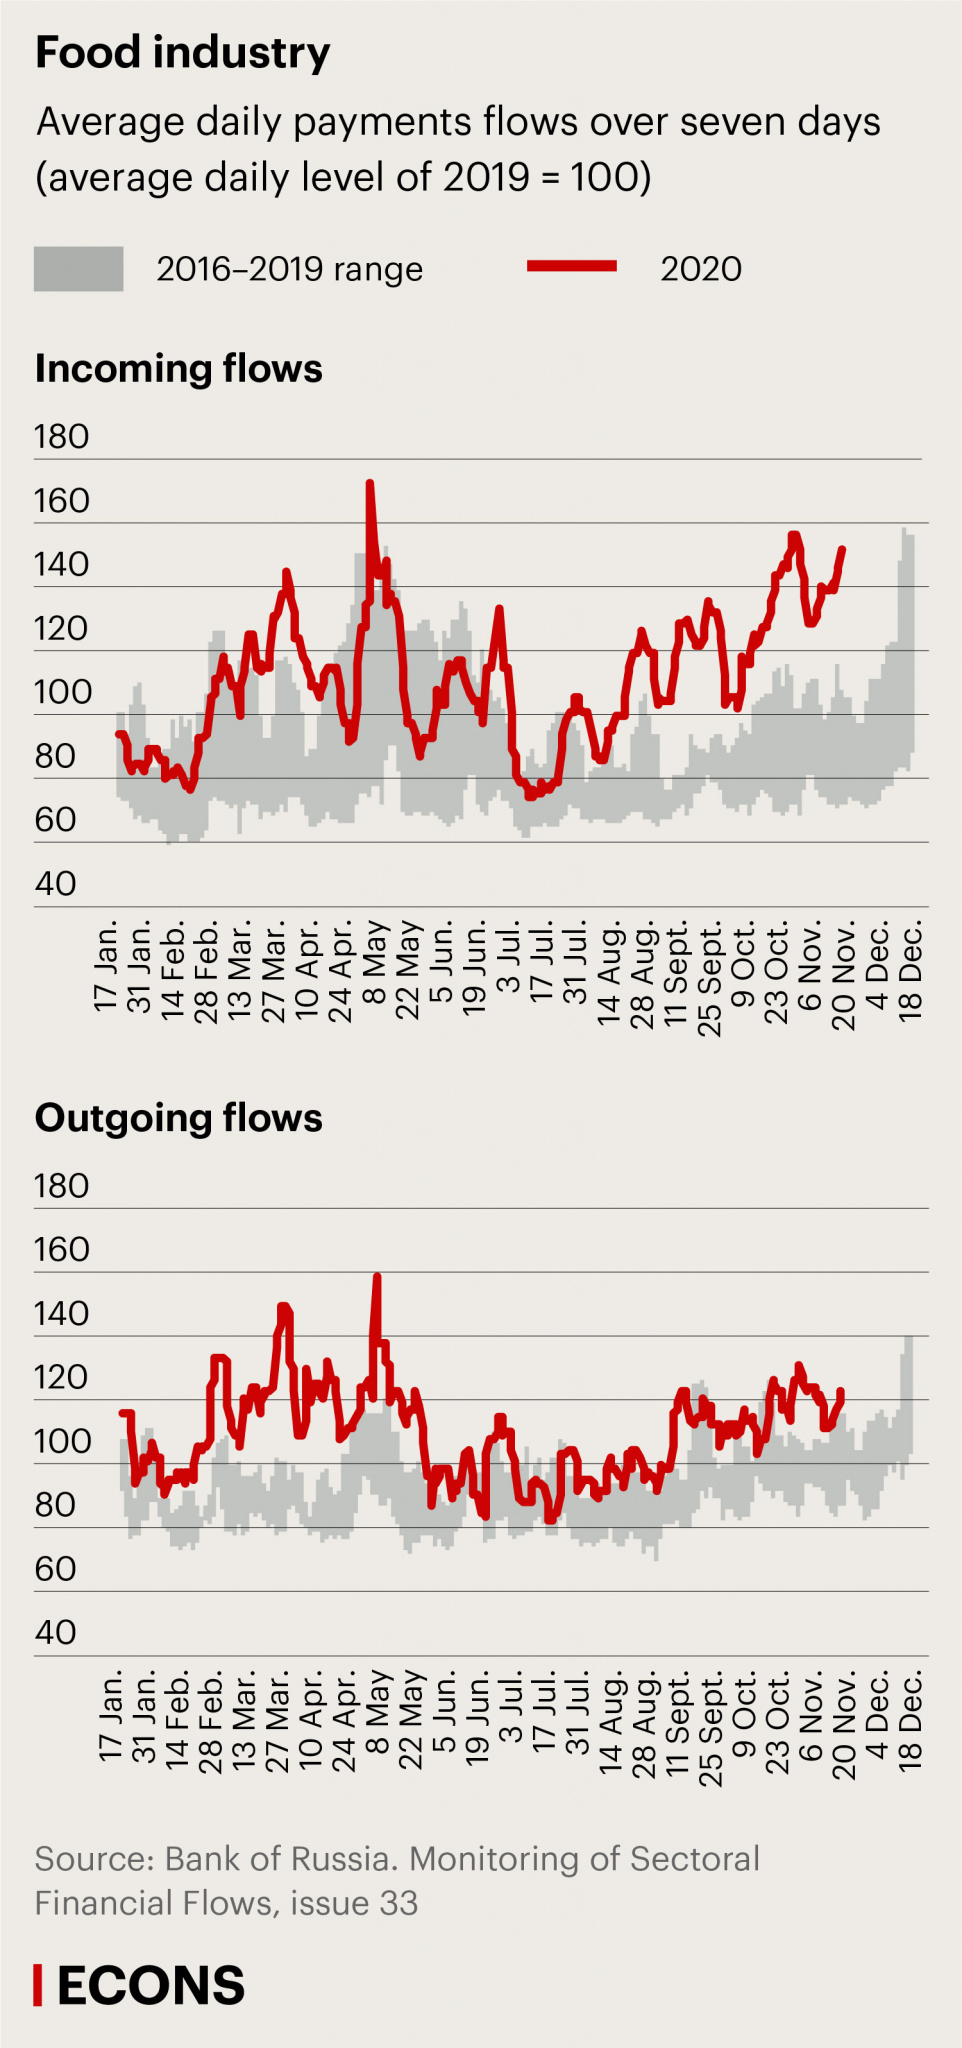
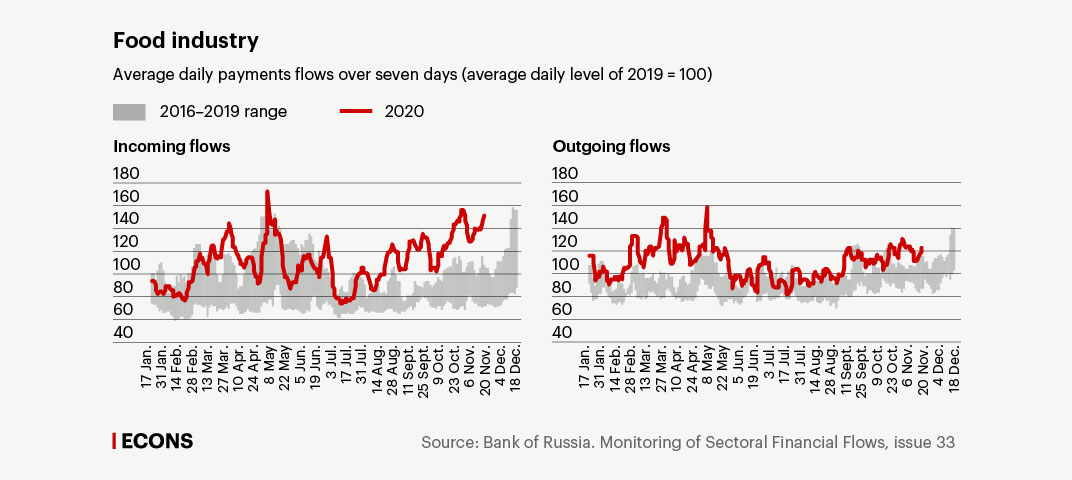
Outgoing financial flows reflect expenditures related to doing business, and here we can also see the pulse of the markets, but in this case, it is determined by technological cycles, supplier settlement styles, and tax payments. The increased flows registered this year may indicate unusual-for-this-time production growth and higher demand for intermediate goods—as can be seen from the chart of outgoing financial flows in the food industry during the first wave of the coronavirus.
The methodology developed by the Research and Forecasting Department of the Bank of Russia allows us to gather these data for each of the 86 types of economic activity listed in the Russian Classification of Economic Activities, OKVED 2 (harmonized with Statistical Classification of Economic Activities in the European Community, NACE Rev.2). For more about our methodology, see this .pdf (in Russian). In addition to industry-specific indicators, we have created indicators that are applicable for the economy in general and larger groups of industries, which are formed based on types of final customers (such as, for example, consumer-oriented industries, foreign consumer-oriented industries, investment demand, and government consumption industries).
Industry performance
Analysis of financial flows in different industries clearly shows both the scale and the heterogeneity of the impact the crisis has had on different sectors of the economy. For instance, at the peak of the crisis, in April–May 2020, the tourism sector, which was hit the hardest, saw its average daily incoming payments flows barely reaching 10% of the pre-pandemic levels registered in February–March 2020, and these were much lower than the average levels registered in April–May of the previous four years. Having seen some recovery in the summer and early fall, in early December, financial flows in the tourism sector are still 2–3 times lower than in 2016–2019.
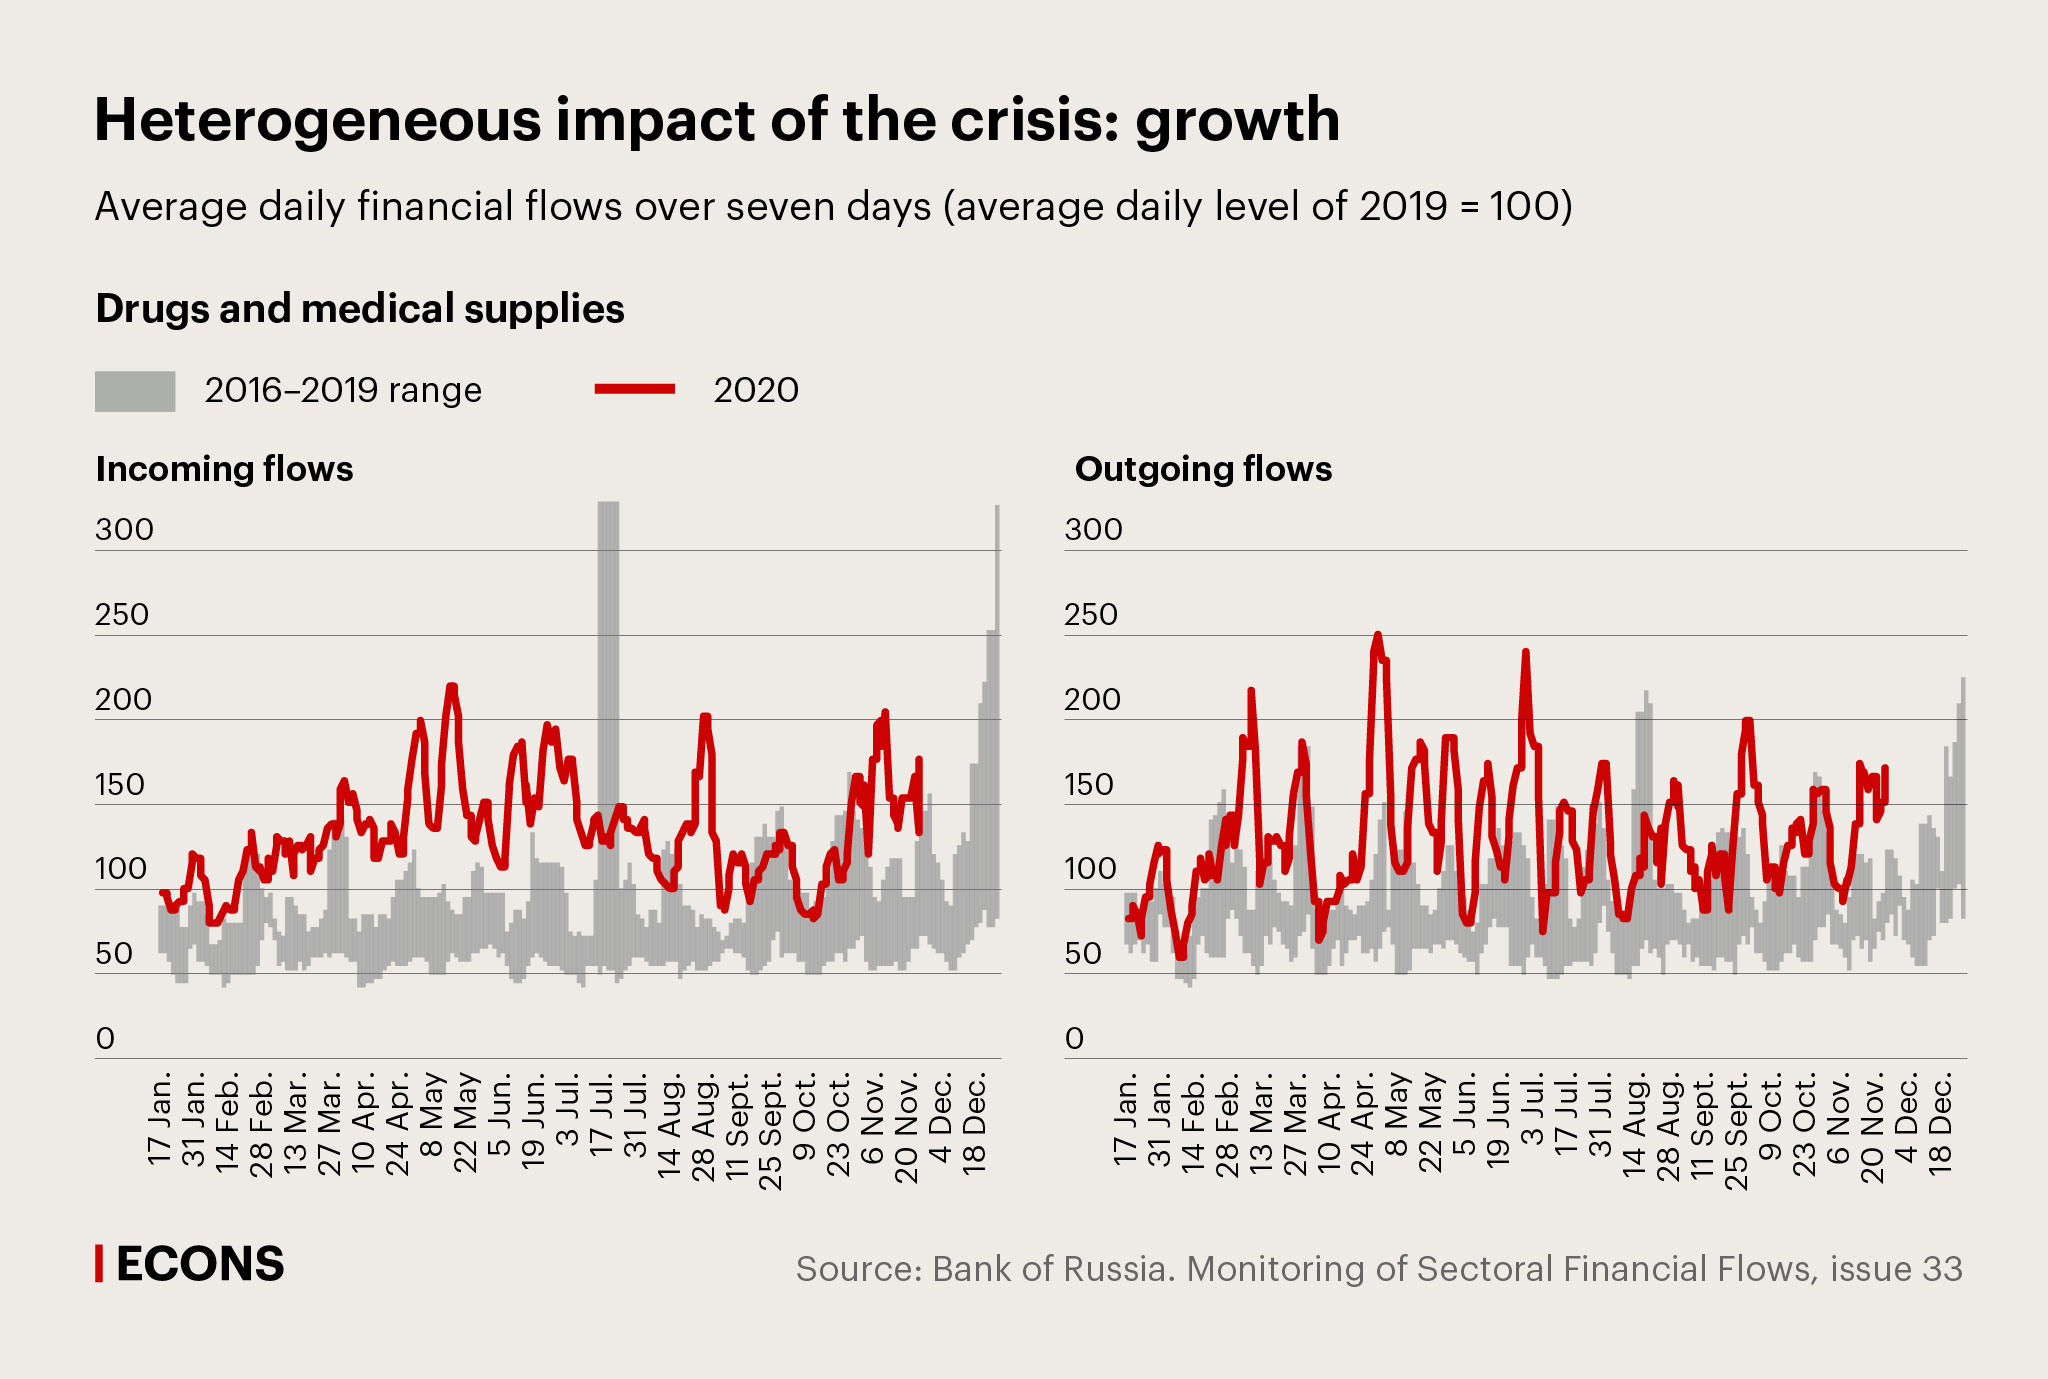
On the other hand, some industries have seen a steady increase in incoming financial flows: for example, drugs and medical supplies (see the charts).
At the trough of the coronavirus crisis, from 30 March to 3 April, 79 of the 86 economic sectors suffered declines in incoming financial flows. According to our estimates, only four of the seven industries that did not experience any decline during that week held up well throughout the pandemic: drug manufacturing, with its average positive deviation from the ‘normal’ levels (that is, exceeding those levels) reaching 28%, textiles (21%), food production (8%), and financial services (11%).
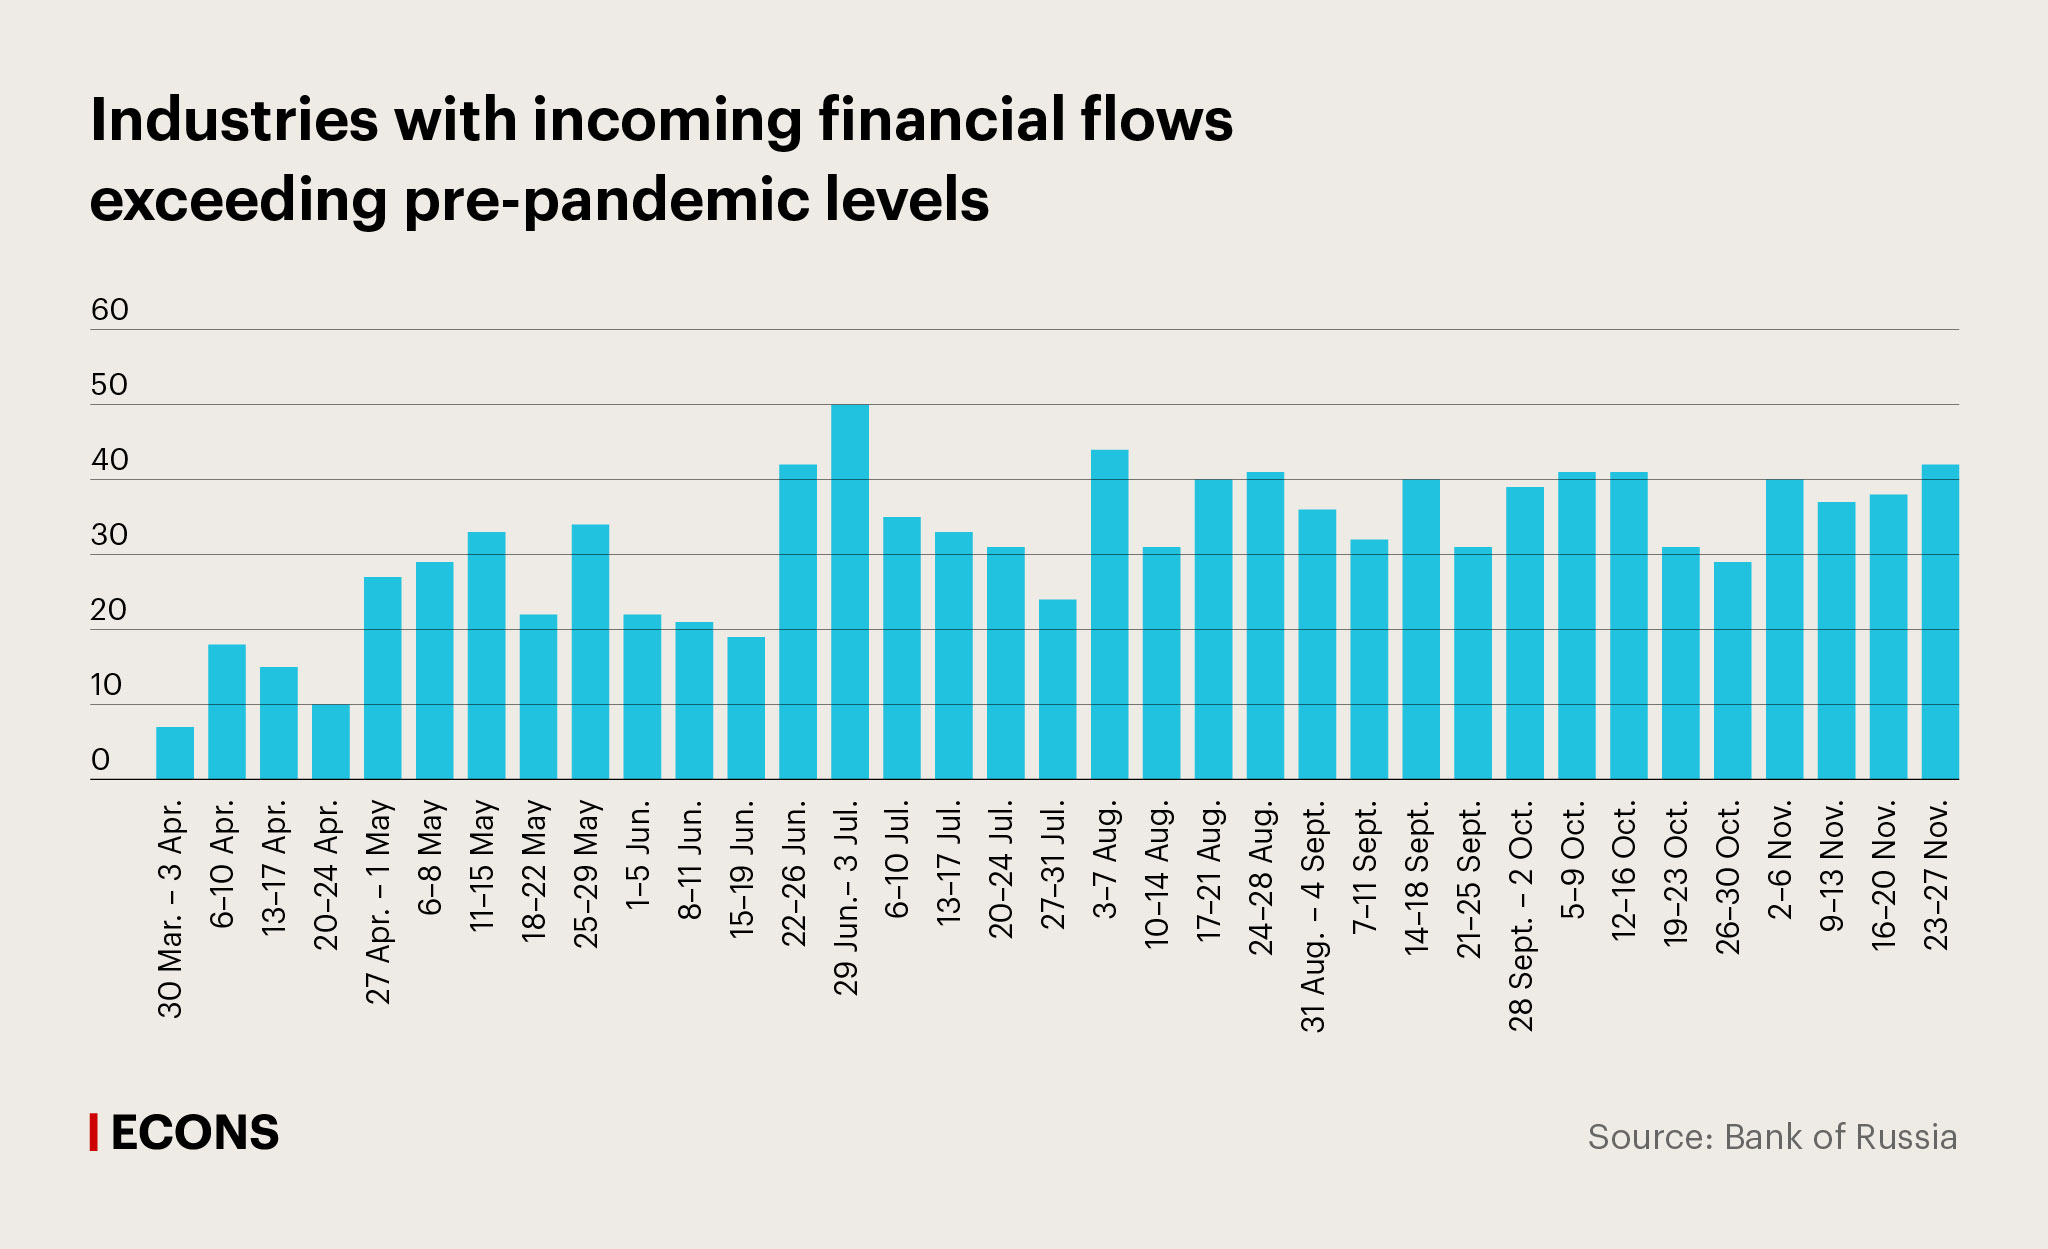
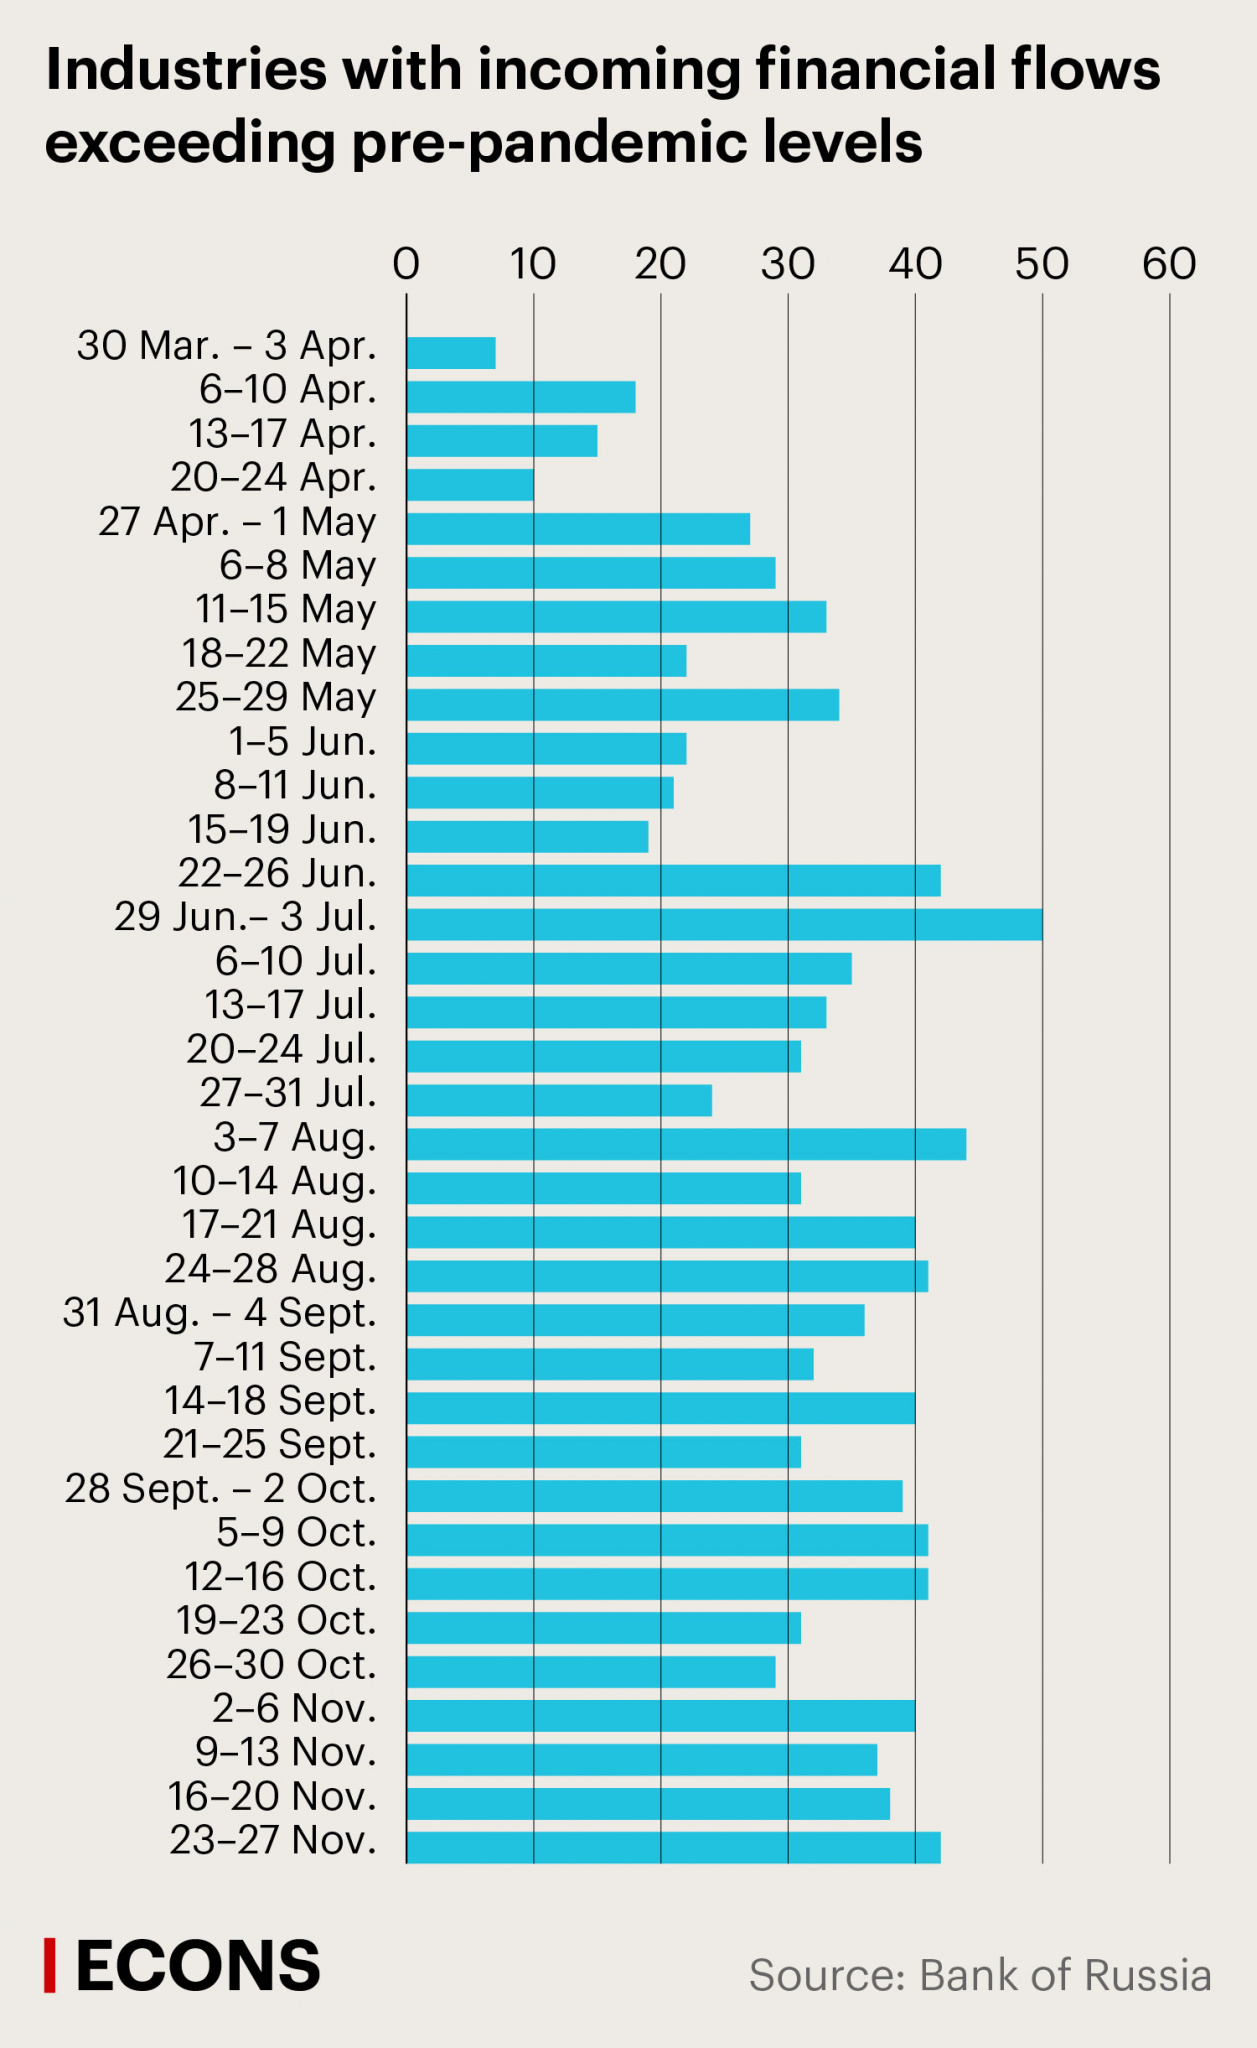
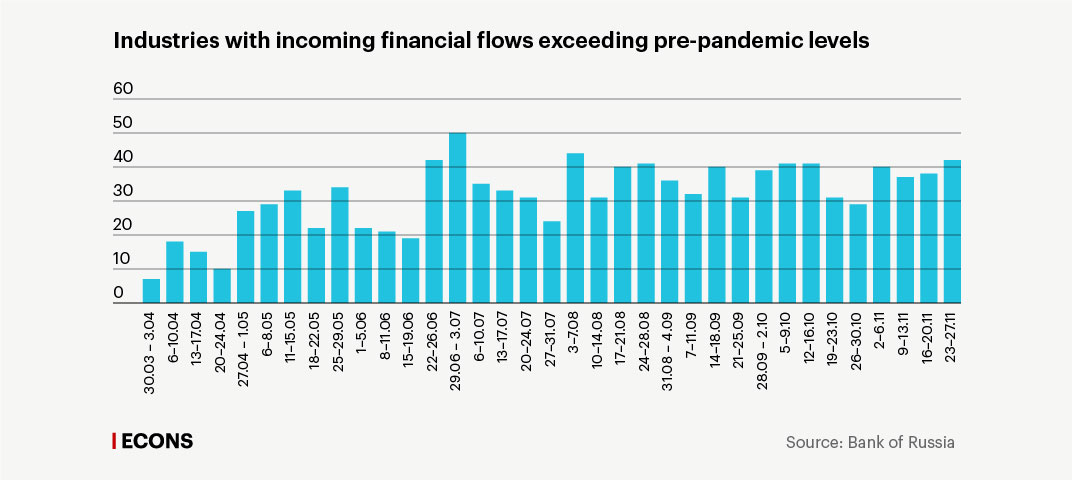
The largest number of industries with positive weekly deviations from the normal level (50) was registered in late June and early July. Recently, slightly fewer than half of the industries show positive weekly deviations; for instance, during the last full week of November (23–27 November), this number was 42, or 48.8% of the 86 economic activities listed in OKVED 2.
In usual times, price effects accumulate toward the end of the year, so most industries and the economy in general tend to register even larger increases in incoming financial flows compared to the beginning of the year. In other words, the fact that the weekly indicators are reaching the ‘normal’ level of the beginning of 2020 indicates that the economic recovery is not complete.
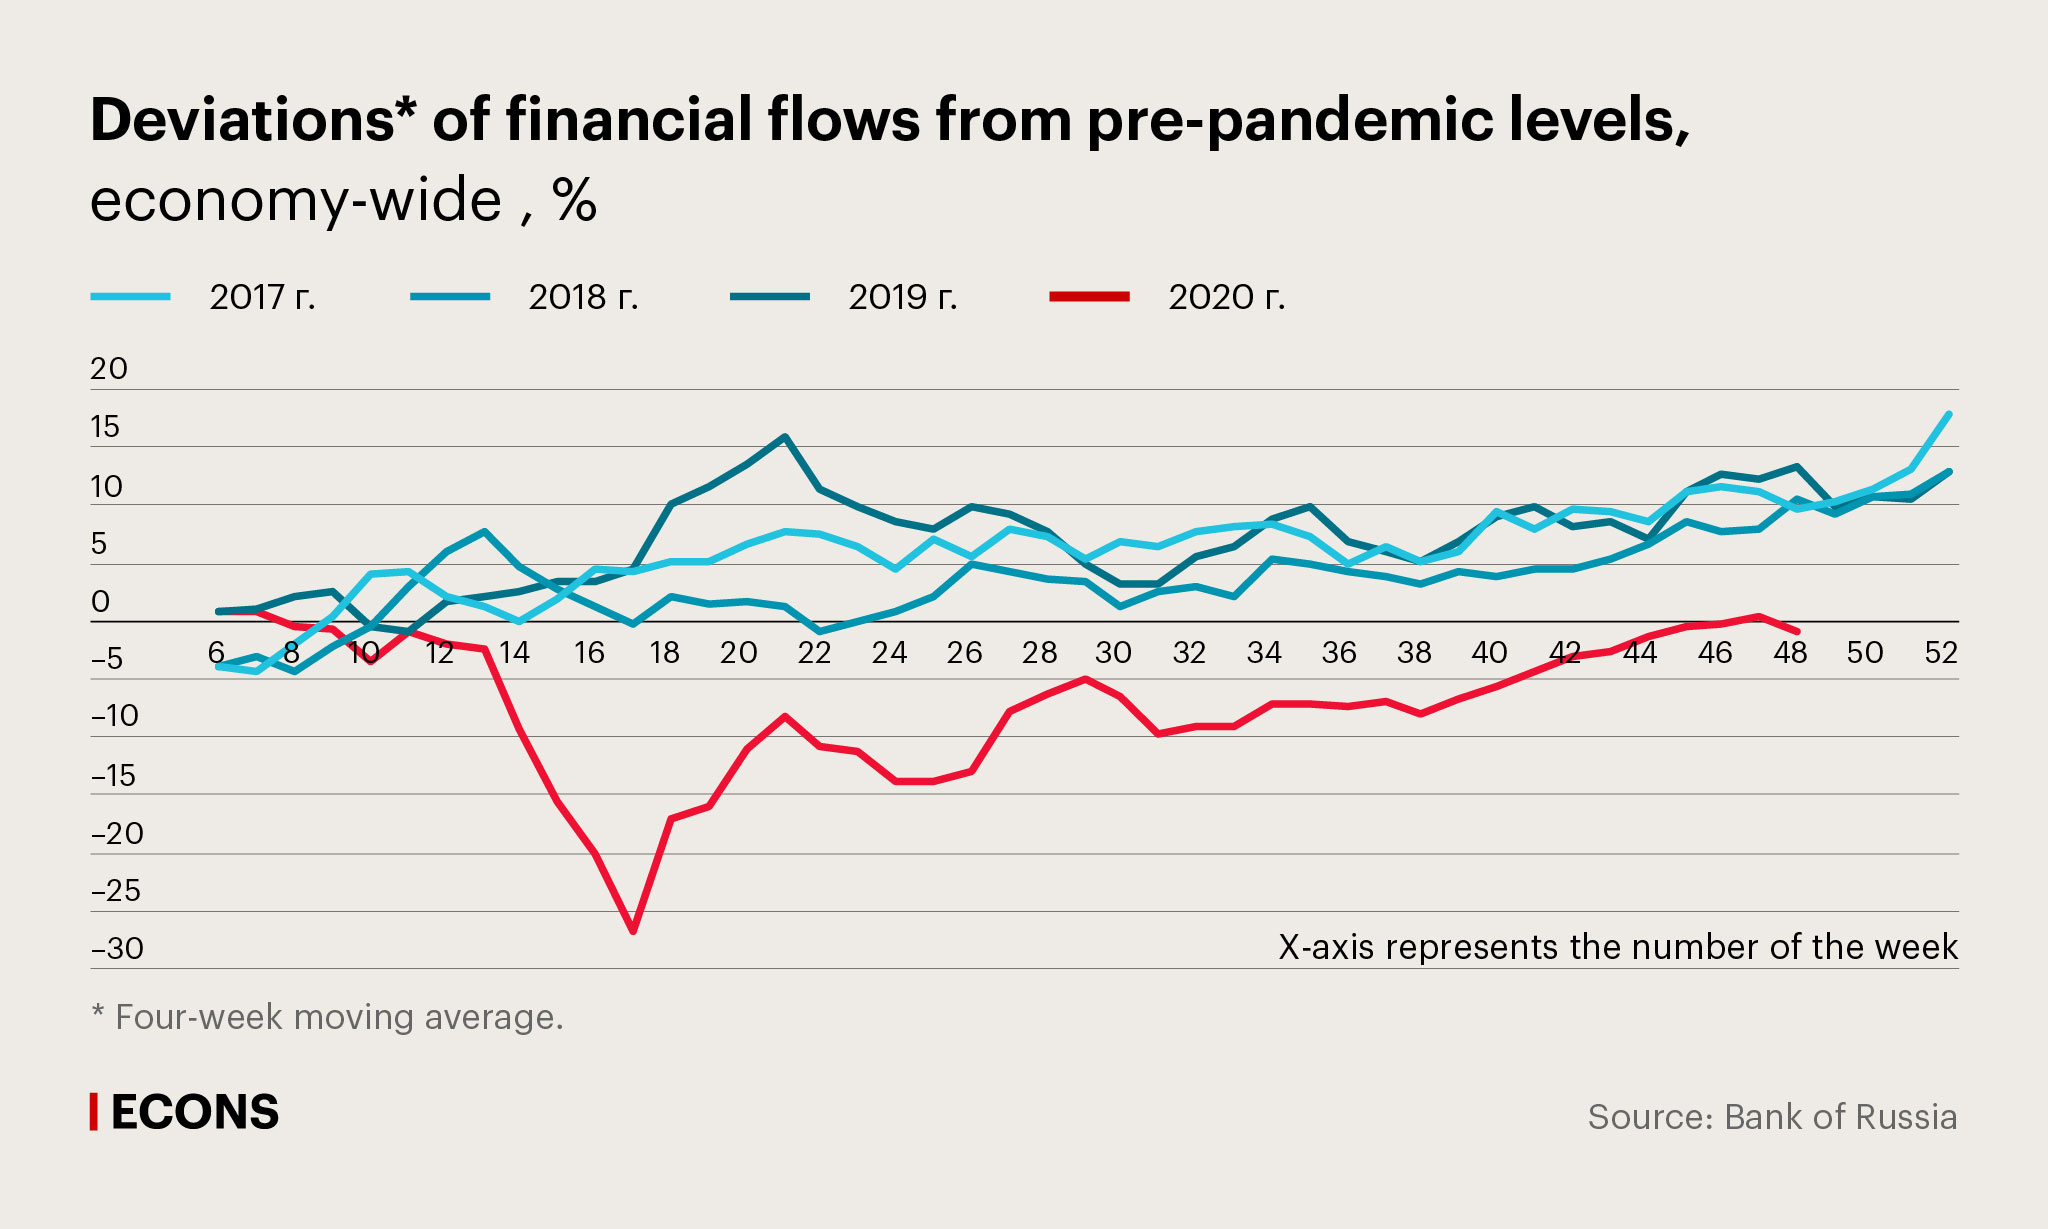
The worst affected industries, whose financial flows have been steadily below the ‘normal’ levels during the entire period of observation, can be conveniently divided into three groups. The first is services involving face-to-face interaction or a large number of people at the same time: tourism, with its average weekly deviation from March to November at minus 73%; art and entertainment (minus 47%); libraries, archives, museums and other cultural institutions (minus 47%); and movies (minus 37%).
The second group consists of industries whose final consumers are overseas. They are suffering from the external negative conditions registered in the global energy and commodities markets in April–October 2020: crude oil and natural gas (minus 37%), iron and steel (minus 32%), and coal (minus 28%). The third group can be tentatively defined as investment goods and services. It includes architectural and engineering services (minus 41%) and renting and leasing, with average weekly incoming financial flows falling by 28% for the entire period of observation.
Economy-wide indicator
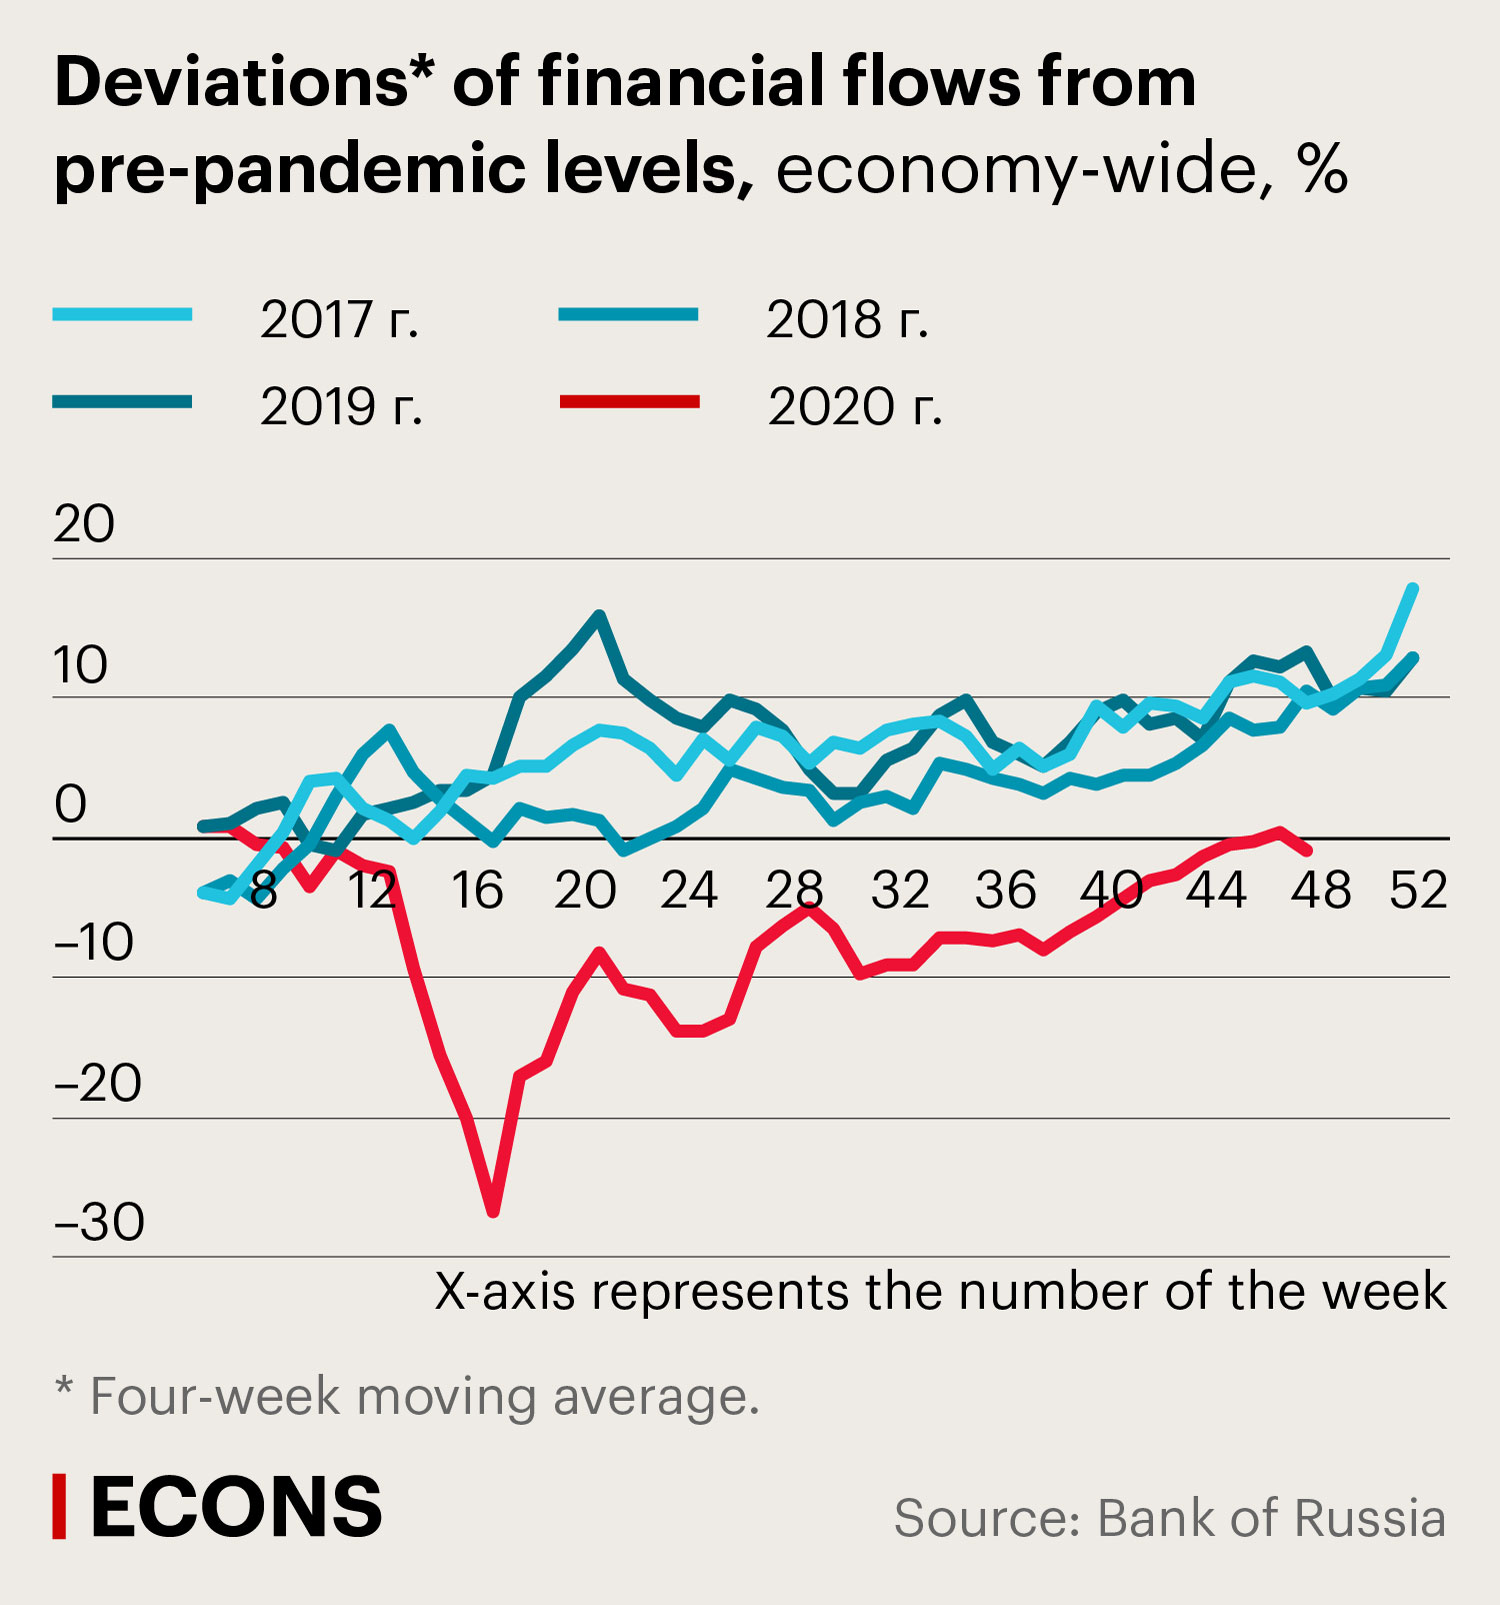
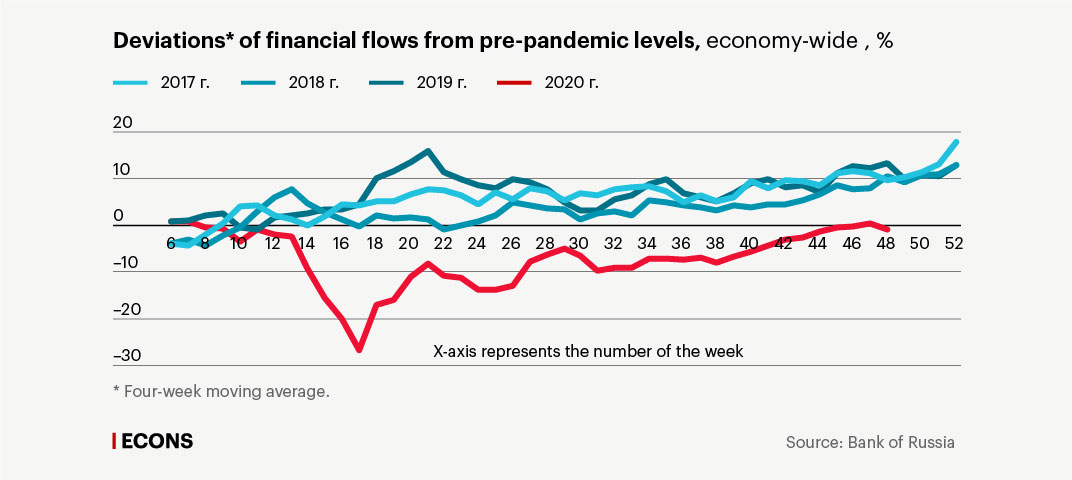
Economy-wide deviations of incoming financial flows are used as an indicator of the overall economic situation.
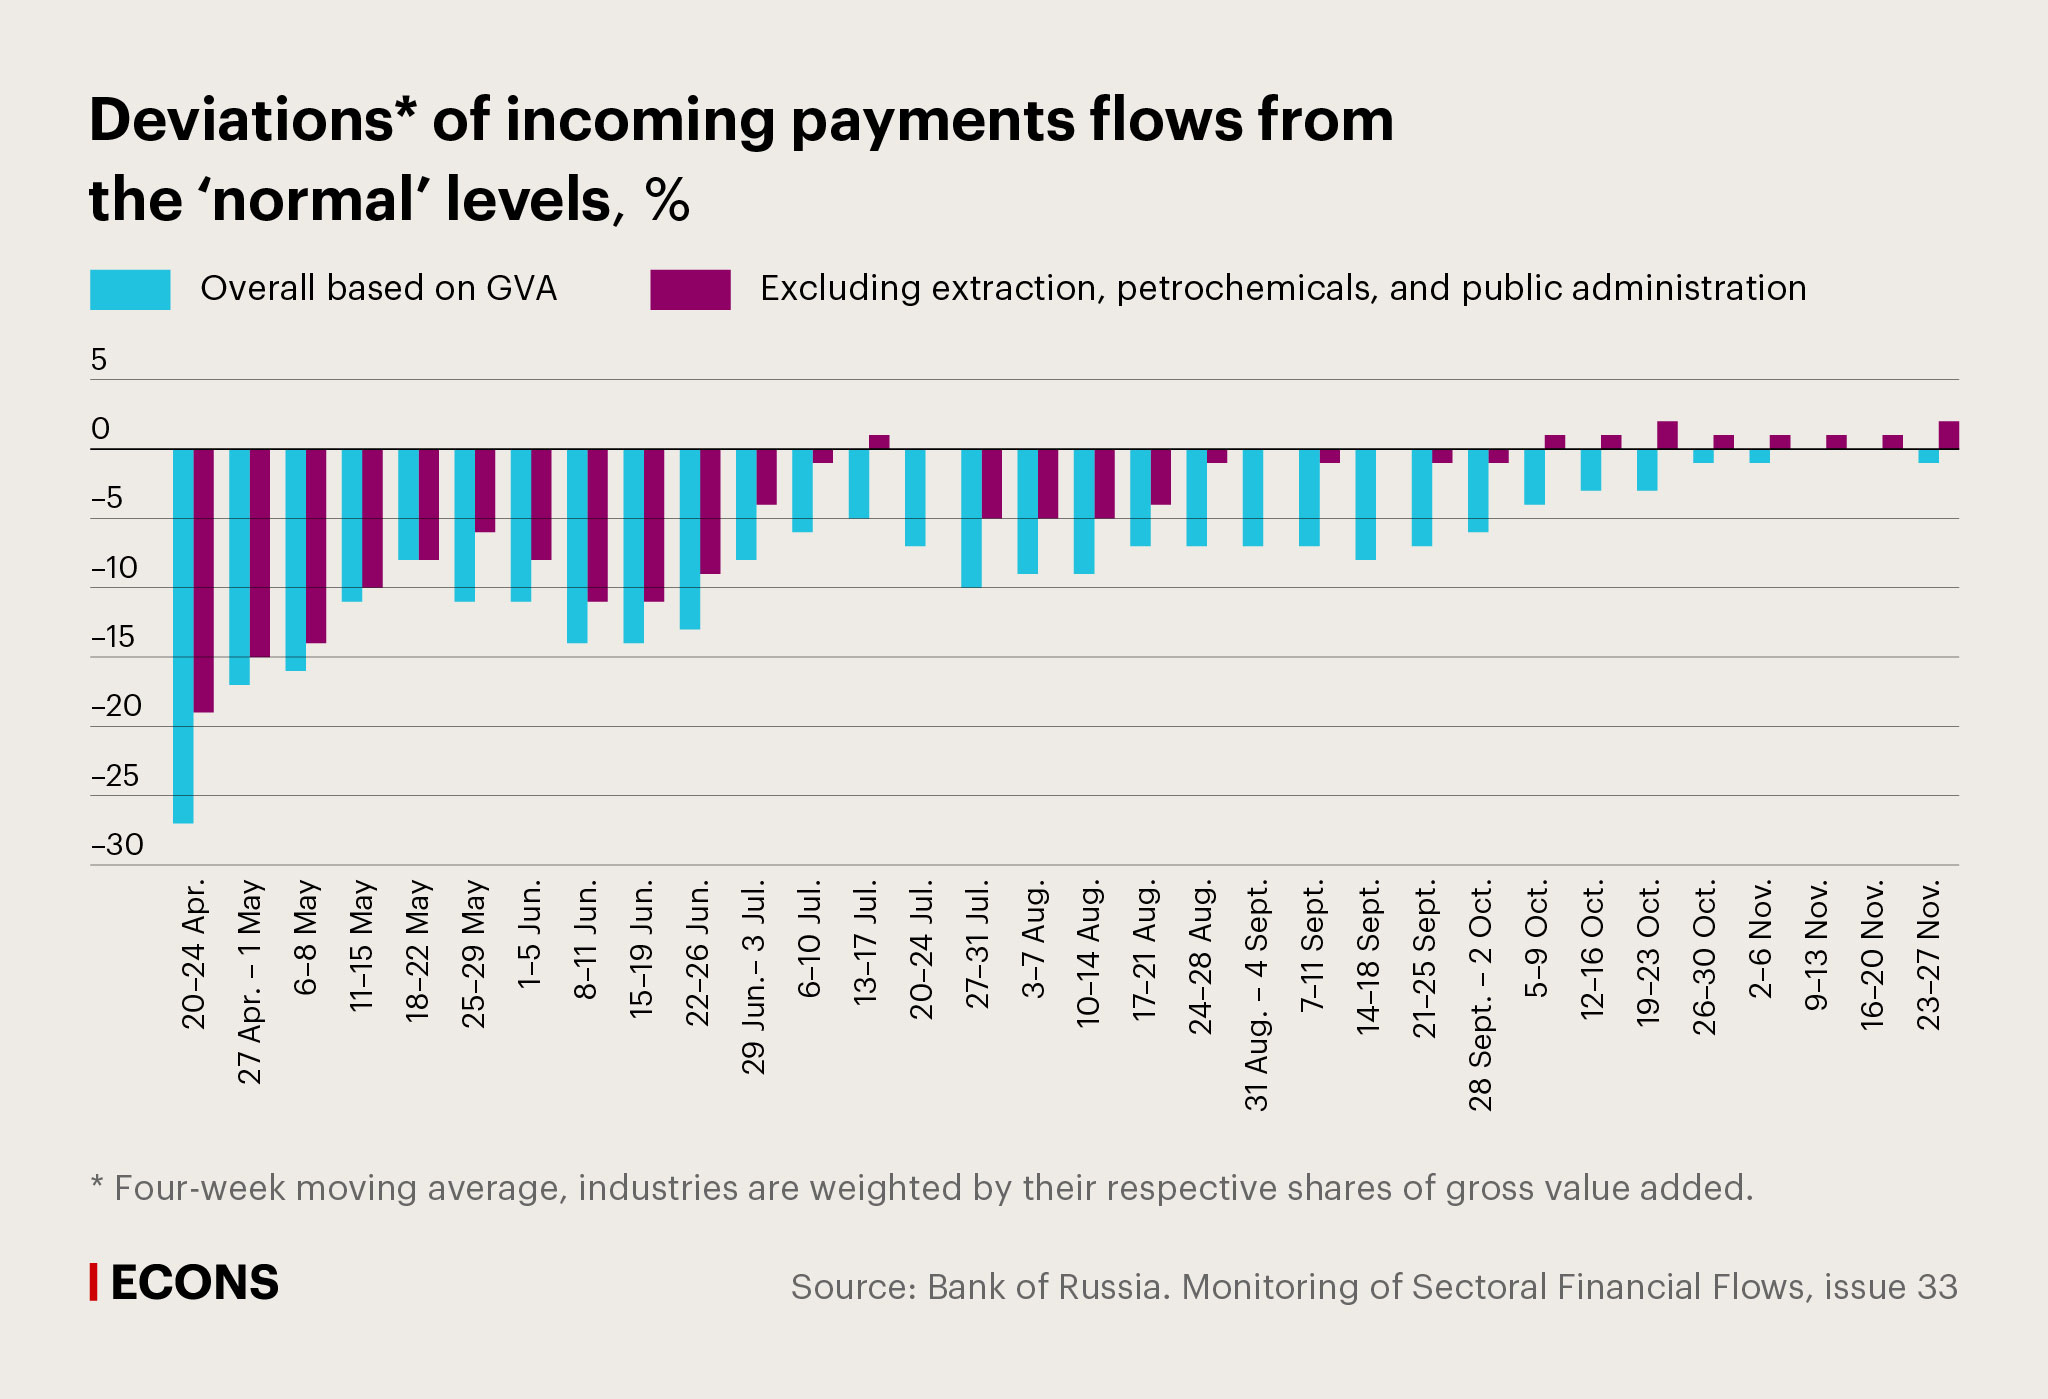
At the trough of the crisis, the deviation from the ‘normal’ level exceeded 25%. By early November, it had almost disappeared: incoming flows had recovered. This means that when it comes to the overall economic situation, the incoming financial flows in all industries listed in OKVED 2 and weighted by the share of each industry in gross value added have reached the average level of the beginning of the year. In other words, in the Russian economy as a whole, the amount of available financial resources has reached the level of the beginning of the year.
However, this is a so-called statistical Frankenstein: the coronavirus crisis has caused unprecedented changes at the industry level, which are reflected, among other things, by the varying financial flows across some domestic- and foreign-customer oriented groups of industries.
The industries related to oil extraction and refining show quite different trends. These companies found themselves in a difficult situation characterised by the simultaneous shocks generated by plummeting global energy prices and voluntary limits within the framework of the OPEC+ deal. This led to an average 37% decline in incoming financial flows in the crude oil and natural gas sector and a 22% decline in the coke and petrochemicals industry. To distinguish the effects associated with external changes, these groups of industries were separated from the overall economy (see the chart).
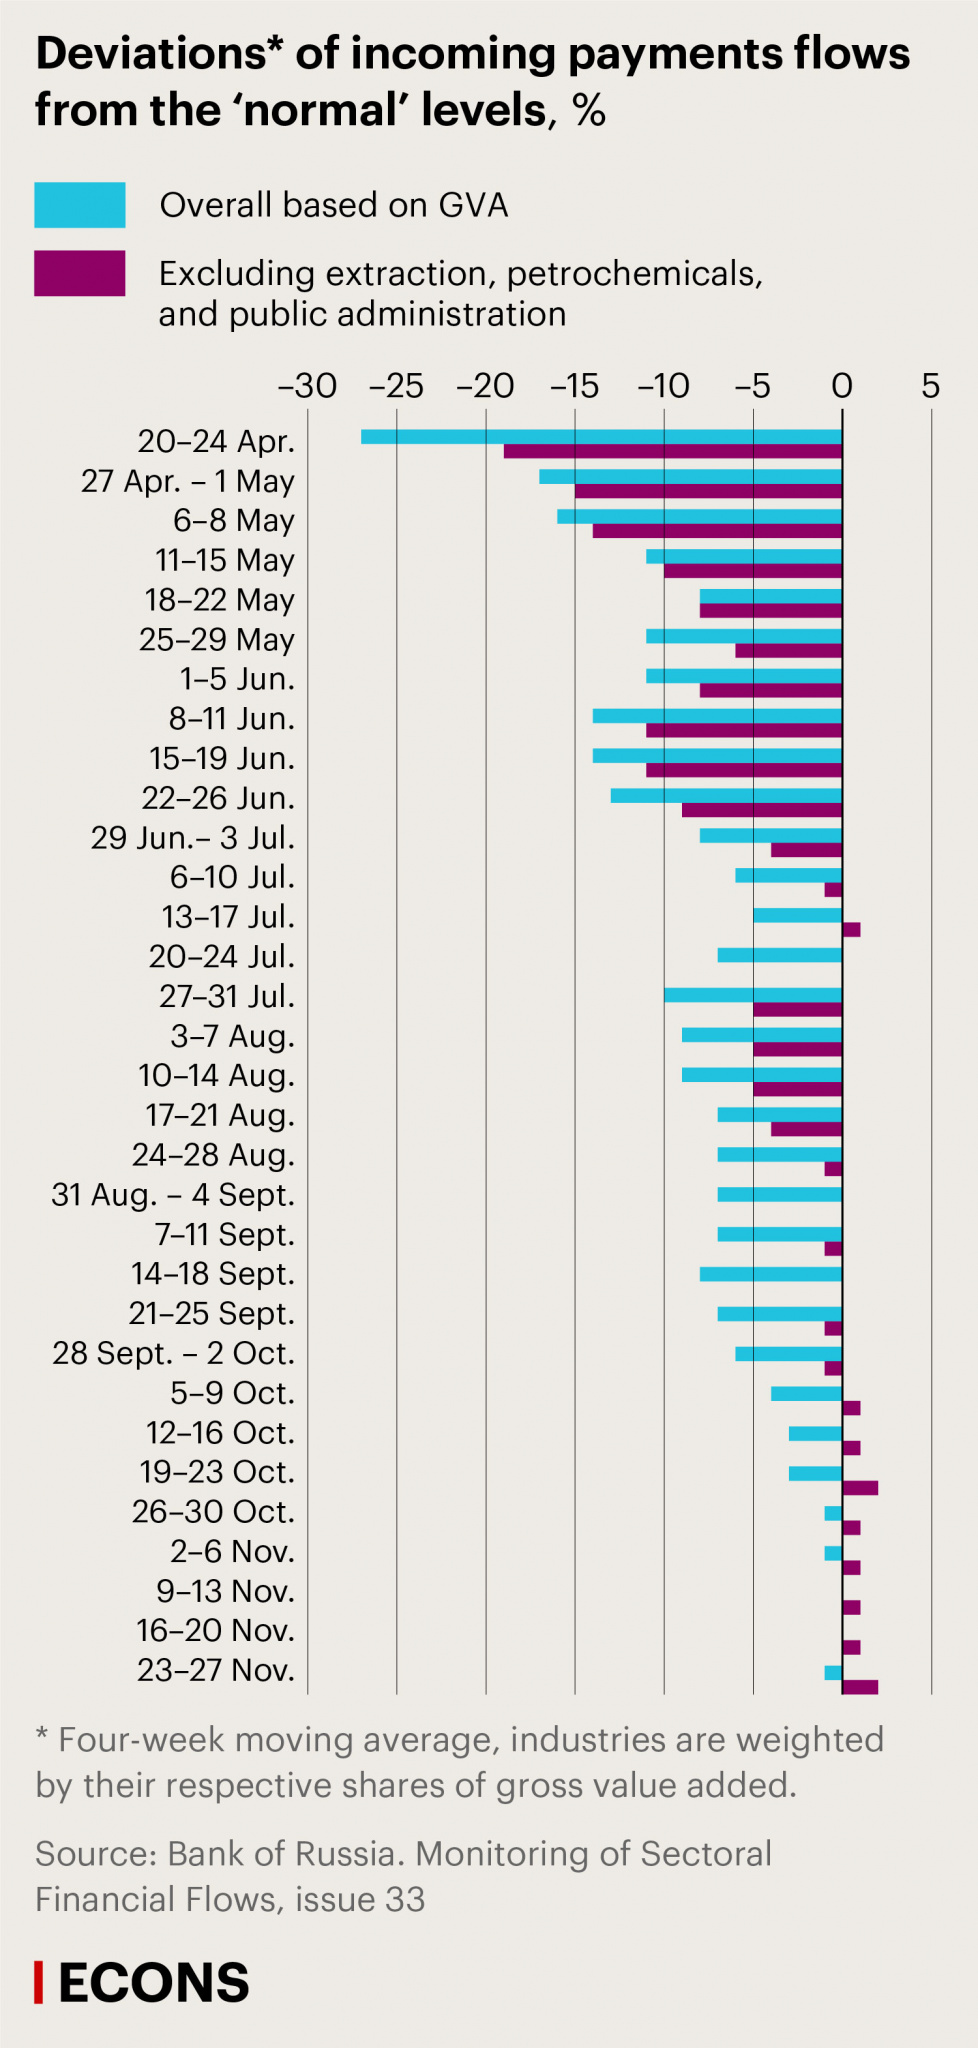
It is worth noting that the indicator of industry-specific financial flows is particularly valuable because of its leading nature when it comes to assessing the dynamics of GDP directly in a period of sharp economic fluctuations. For example, a sudden drop in financial flows during a crisis indicates growing financial problems in the industry which are not necessarily immediately reflected in its production indicators.
Thus, if we compare the changes in the financial flows of major industries with the data Rosstat provides on the changes in gross value added (GVA) in Q2 of 2020 (the period of most acute crisis), we notice a fairly high correlation between these indicators (the pair correlation was 56%).
Analysis and forecasting
How can we benefit from this result in forecasting economic dynamics? On one hand, the close correlation we found between the changes in financial flows and GVA during the crisis suggests that the former can be used as a key indicator with a sufficient degree of reliability.
On the other hand, a number of the short-term indicators of economic activity included in the official statistics, despite the lag in their publication (for instance, data on industrial production, retail turnover, employment, and lending are published monthly), and well-known survey indicators (most of all, PMI indices) also demonstrate quite good leading potential. Each of these indicators has its own peculiarities: for example, they may focus on supply dynamics more than on demand or, vice versa, give a good reflection of consumer activity as a demand factor but an inadequate reflection of intermediate and investment demand or supply factors.
At the same time, taken together these indicators can successfully complement each other in short-term GDP forecasting. This is, to a great extent, why global empirical experience confirms that reliable short-term GDP forecasts are based on a combination of real-time indicators rather than on a single one.
We should also keep in mind that industry-specific financial flows are not real, but nominal values, which over a given period, can be influenced by the accumulated growth or decline of prices, among other things. The latter leads us to treat inter-industry financial flows with extreme caution when projecting them onto real economic activity.
The most important feature of the higher-frequency indicator of industry-specific financial flows, in addition to its real-time nature, is its ability to form, almost in real time, a reliable substantive vision of current economic dynamics at the industry level. It is this understanding, rather than simple correspondence with real GDP data (which is not only published with a lag but also revised subsequently), that is crucial for a central bank in the making of monetary policy decisions.
Let us illustrate this point with a specific example of the use of financial flows data during the coronavirus crisis. Analysis of daily data on industry-specific financial flows helped identify, almost in real time, the first signs of an emerging recovery trend in a number of manufacturing sectors back in May, when the official short-term statistics showed the trough of the recession. In particular, in some industries whose recovery the official statistics began to register only in June, financial flows showed moderate growth back in May.
At the same time, the real-time data also reflected how the negative effects in the industries whose activities were seriously restricted or suspended by direct restrictions aimed at fighting the spread of the coronavirus influenced associated industries through a decrease in the solvent demand for their products. The real-time daily data on financial flows in the industries listed in OKVED 2 made it possible to distinguish between the positive trends registered in some manufacturing industries and the decrease in the extractive sector and related industries due to the restrictions on oil production imposed since 1 May as part of the OPEC+ agreement.
Thus, in mid-June, when the Board of Directors was making its monetary policy decisions, the Bank of Russia already knew about the gradual recovery beginning in some sectors and its scale, as well as about the industries that were the key drivers of this recovery as the restrictions were gradually lifted, and, on the other hand, about the industries that had begun to experience negative secondary effects from the restrictions. This detailed data on economic dynamics at the level of industries would be difficult to obtain in such a timely manner through the other real-time indicators available, let alone through the official statistics.
Industry-specific financial flows were rather quickly returning to their pre-crisis levels during most of the summer, thanks to the short-term positive impact of the lifting of the majority of the restrictions introduced in spring. But in general, the recovery was rather uneven: quite strong growth in consumer industries was accompanied by a much more moderate recovery in investment sectors, with financial flows in exporting and intermediate demand industries, as well as in the industries that were worst affected by the pandemic, staying low. This shows that consumer-oriented industries are the first to close the negative output gap as the economy gradually recovers. In its turn, the heterogeneous nature of the output gap in different industries is an important factor which central banks should take into account when assessing proinflationary and disinflationary risks as a basis for monetary policy decisions.
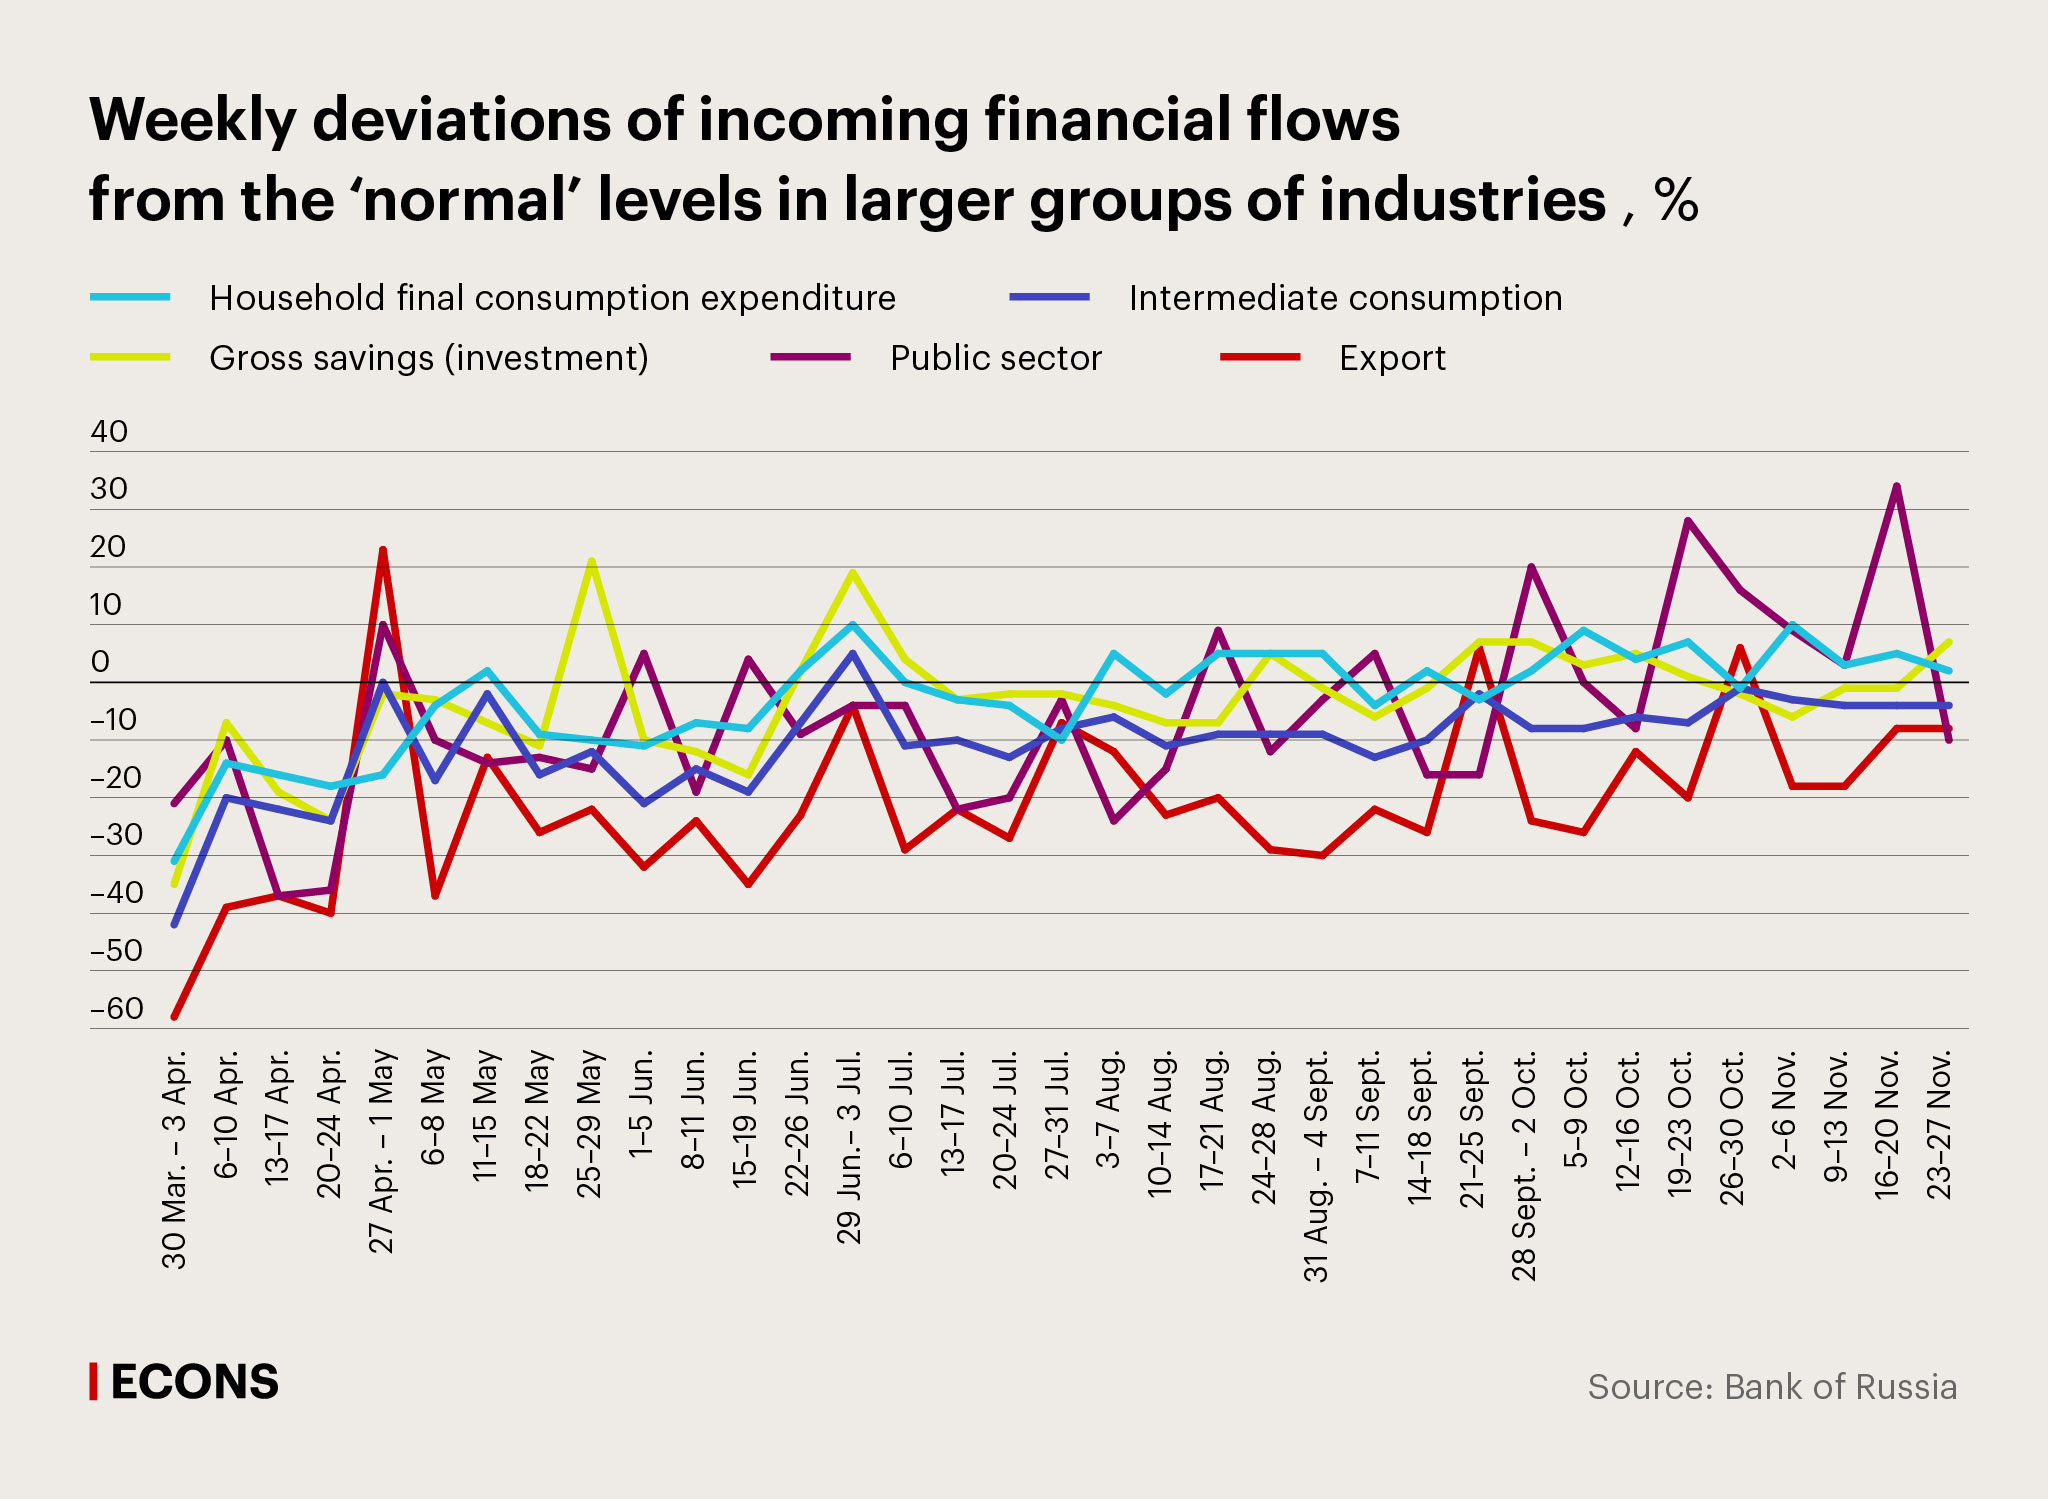
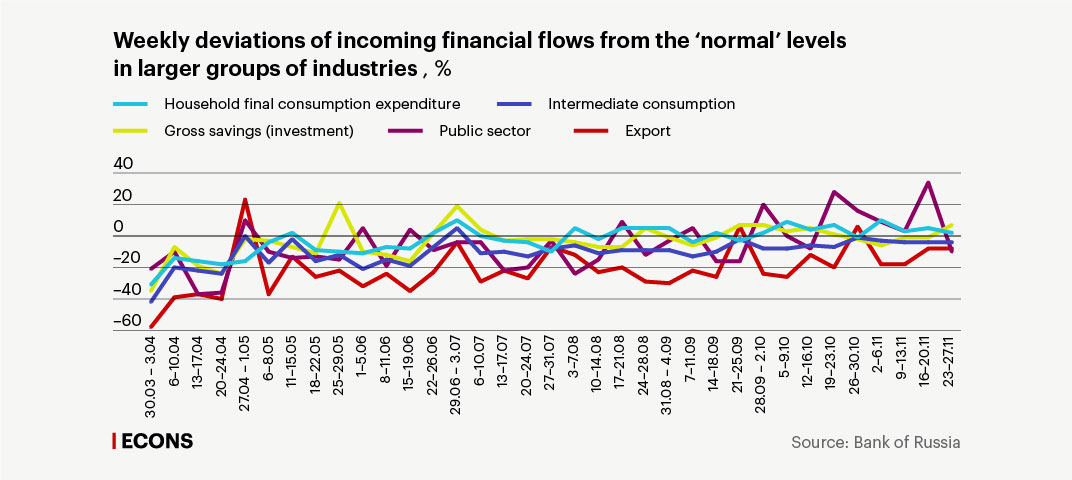
For the time being, it would be extremely premature to talk about a robust recovery from the crisis, given the persisting external uncertainty as well as the significant scale and duration of the secondary effects of the spring restrictions. For example, only four industries registered positive weekly deviations throughout all three fall months: food production, textiles, professional science and technology, and animal health. Since September–October, the amount of inter-industry financial flows has generally stabilised close to pre-crisis levels, which, on the one hand, indicates weaker economic dynamics in Q4 compared to Q3 of 2020 amid a worsening pandemic situation, but, on the other hand, shows that the registered slowdown of economic growth is limited due to the restrictions being more selective. We can expect that as the autumn corona wave winds down, the economy will be able to return to its registered gradual recovery in the first half of 2021.
The results of the current NPS data analysis are just the first steps in using higher-frequency data to analyse economic activity. From a practical point of view in terms of policy use, the results of financial flows monitoring are applicable in a wide range of fields: they are useful not only in the operational analysis of economic activity and short-term and medium-term price risks, but also in long-term research of the real and financial sectors.


